

Image Source: Freepik
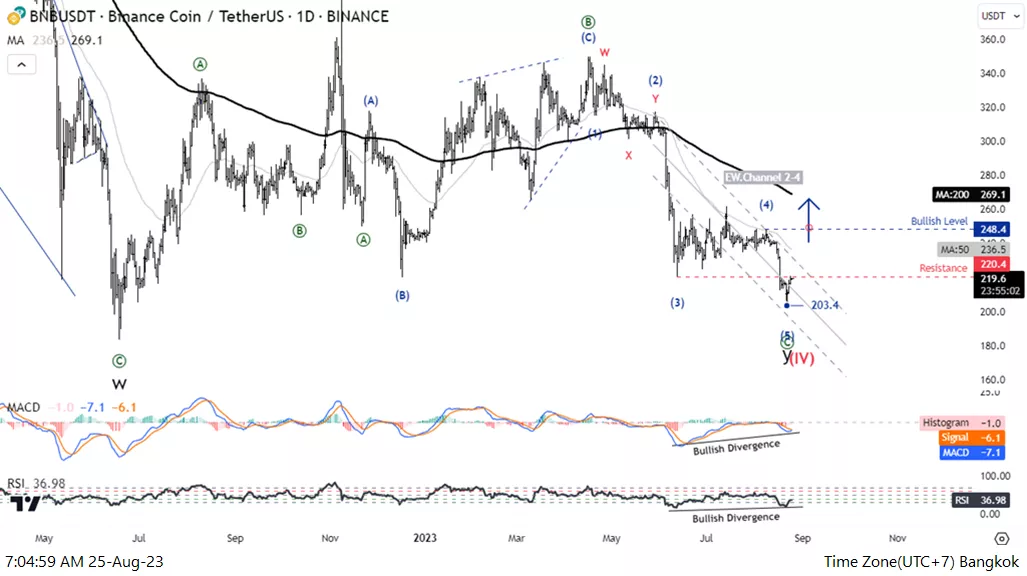
Elliott Wave Analysis TradingLounge Daily Chart, 25 August 2023.
Binance Coin/U.S. Dollar(BNBUSD)
BNBUSD Elliott Wave Technical Analysis
Function: Follow Trend
Mode: Motive
Structure: Impulse
Position: Wave (5)
Direction Next higher Degrees: wave ((C)) of Zigzag
Wave Cancel invalid level:
Binance Coin/U.S. Dollar(BNBUSD) Trading Strategy: Binance coin is still in a downtrend. As the price remains below the MA200 and MA50 lines, the price structure is at the end of the downtrend in the Zigzag wave C which has a chance of ending at the 203 level.
.5 and we are looking at a five-wave increment to support this idea. An important resistance level to consider is the level 202.4, if it fails to pass, it can lead to further declines.
Binance Coin/U.S. Dollar(BNBUSD) Technical Indicators: The price is below the MA200 indicating a downtrend, MACD and RSI have bullish divergence.
Analyst: Kittiampon Somboonsod, CEWA
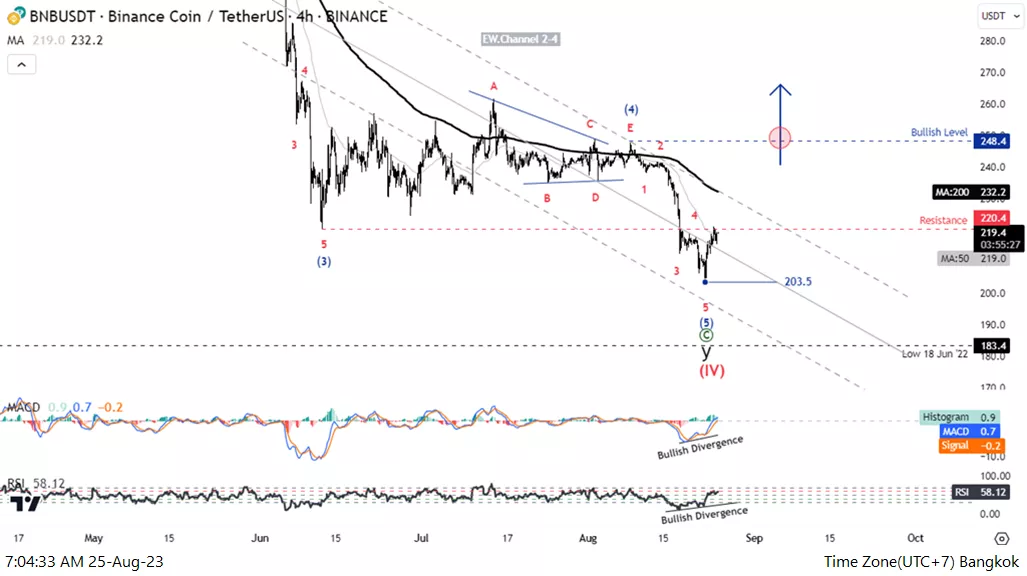
Elliott Wave Analysis TradingLounge 4H Chart, 25 August 2023.
Binance Coin/U.S. Dollar(BNBUSD)
BNBUSD Elliott Wave Technical Analysis
Function: Follow Trend
Mode: Motive
Structure: Impulse
Position: Wave (5)
Direction Next higher Degrees: wave ((C)) of Zigzag
Wave Cancel invalid level:
Binance Coin/U.S. Dollar(BNBUSD) Trading Strategy: Binance coin is still in a downtrend. As the price remains below the MA200 and MA50 lines, the price structure is at the end of the downtrend in the Zigzag wave C which has a chance of ending at the 203 level.
.5 and we are looking at a five-wave increment to support this idea. An important resistance level to consider is the level 202.4, if it fails to pass, it can lead to further declines.
Binance Coin/U.S. Dollar(BNBUSD) Technical Indicators: The price is below the MA200 indicating a downtrend, MACD, and RSI have bullish divergence.
More By This Author:
Elliott Wave Technical Analysis Day Chart: U.S. Dollar/Swiss Franc
Elliott Wave Technical Analysis: Intuit Inc.- Thursday, August 24
Elliott Wave Technical Analysis 4 Hour Chart - U.S. Dollar/Swiss Franc


Comments
Log in or sign up to join the conversation.