
Some Time Series Data On Mass Shootings

Image Source: Pixabay
Assault weapons ban and Trump effects.
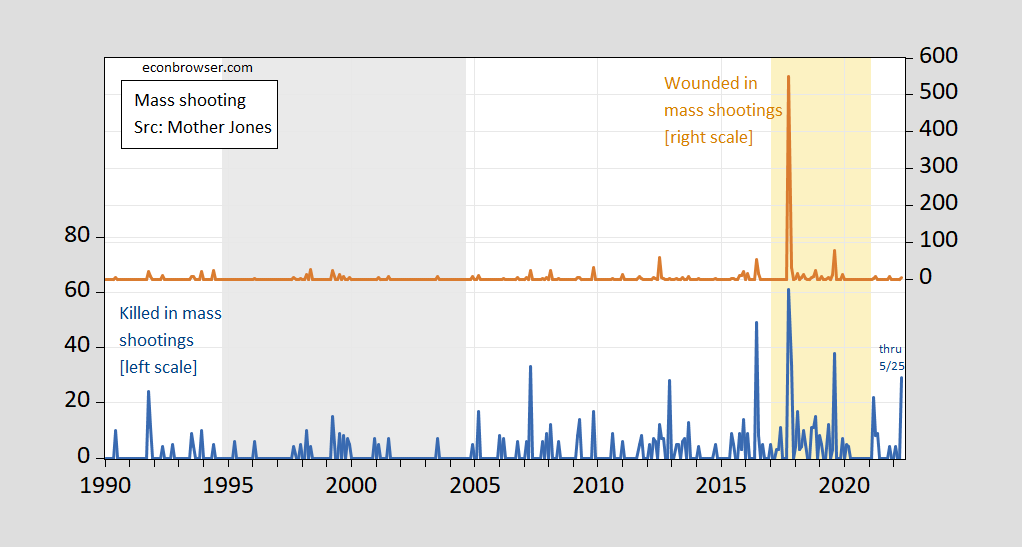
Figure 1: Mass shooting fatalities (blue, left scale), and wounded (brown, right scale). Gray shading denotes assault weapons ban; orange denotes Trump administration. Source: Mother Jones accessed 5/2/2022, author’s calculations.
Notice that there seems to be a correlation (inverse) with the assault weapons ban, and correlation (positive) with the Trump administration.
In order to conduct a statistical analysis of these correlations, I construct a “mass shootings casualties” variable, which is the sum of the above two variables.

Figure 1: Mass shooting fatalities (blue var), and wounded (brown bar). Total height is “Mass shooting casualties”. Gray shading denotes assault rifle ban; orange denotes Trump administration. Source: Mother Jones accessed 5/2/2022, author’s calculations.
Estimate over 1990M01-2022M05 (through 5/25 for May) using negative binomial regression, with ban is a dummy variable for assault weapons ban, trump is a dummy variable for the Trump administration, and pop is population in thousands.
casualtiest = –1.72 – 0.71 bant + 1.45 trumpt + 0.00001popt
Adj-R2 = 0.045, SER = 33.4, NOBS = 363. Bold denotes significance at 10% msl, standard errors corrected for overdispersion (GLM option in EViews).
In words, each year under the assault weapons ban, 71 percent less people are injured or killed. In contrast, in each year under the Trump administration, total casualties were 145 percent higher.
Continue Reading Part 2: Some More Correlations on Mass Shootings in the United States
Disclosure: None.


