“Inverted Yield Curve No Longer Reliable Recession Flag, Strategists Say”
That’s the title of an article by S. Ganguly for Reuters.
Nearly two-thirds of strategists in a March 6-12 Reuters poll of bond market experts, 22 of 34, said the yield curve’s predictive power is not what it once was.
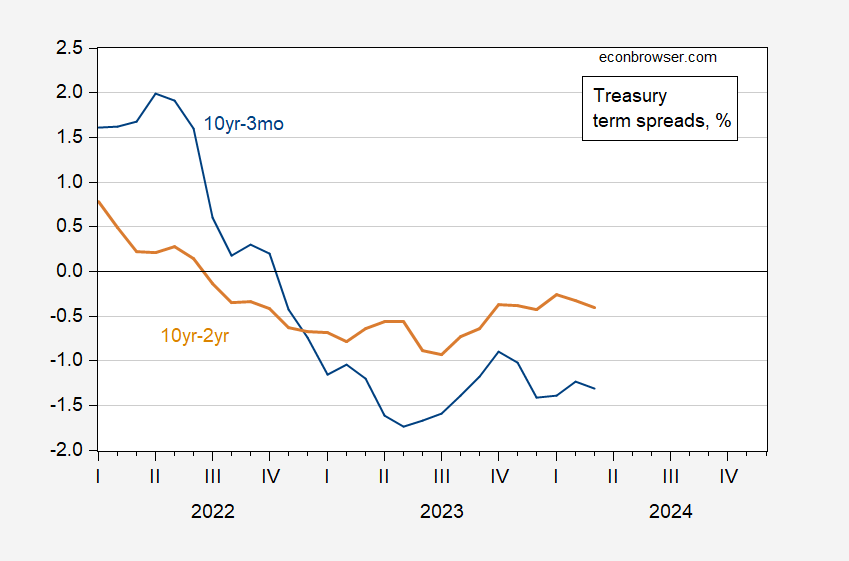
Here’s a picture of spreads, up to March 14th.

Figure 1: 10 year minus 3 month Treasury spread (blue), 10 year minus 2 year (tan), both in %. March for data through 3/14. Source: Treasury via FRED, and author’s calculations.
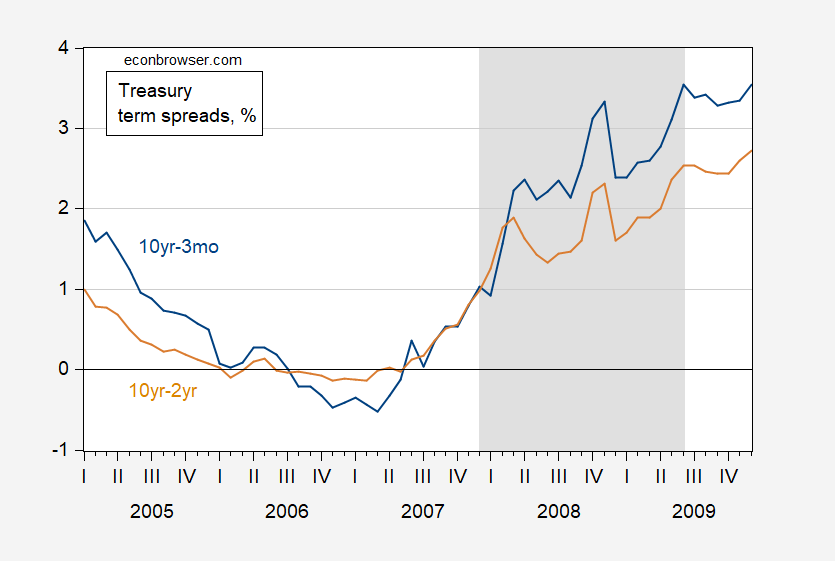
For comparison’s sake, note that the Great Recession was preceded by an inversion that started a year and a half before the NBER-defined peak.

Figure 2: 10 year minus 3 month Treasury spread (blue), 10 year minus 2 year (tan), both in %. NBER defined peak-to-trough recession dates shaded gray. Source: Treasury via FRED, NBER, and author’s calculations.
We are currently about a year and a half from when the 10yr-2yr spread went negative, So I would say it’s still too early to say we’re safe, despite the apparent strength of the economy right now (well, as of February’s data).
Why do some economists discount the inversion’s predictive power this time around?
“If you have these two things going on together – insatiable demand for the long-end from real money like pension funds and the Fed keeping front-end rates higher because of the resilience of the economy – the curve will stay inverted for a while.”
I interpret this meaning the typical correlation between inversion and recession breaking down because the term premium on long bonds is smaller than usual. Consider:

then the 10 year- 3 month term spread is:

With the tp term smaller than usual, then the pure EHTS rate might be higher than for a typical inversion.
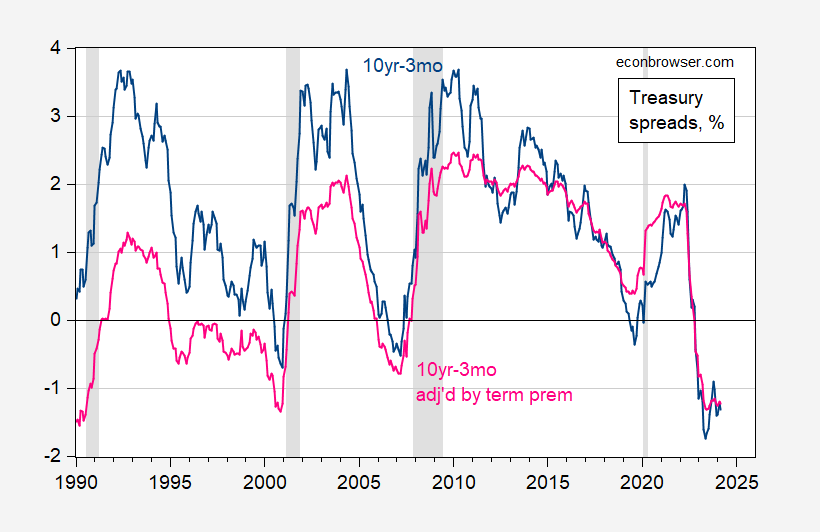
While the low or negative term premium argument sounds plausible, adjusting the spread by an estimated term premium (Kim-Wright 10 year from FRED, series THREEFYTP10), doesn’t seem to change our view of how inversions correlate with subsequent recessions.

Figure 3: 10 year minus 3 month Treasury spread (blue), 10 year minus 3 month adjusted by estimated Kim-Wright term premium (pink), both in %. NBER defined peak-to-trough recession dates shaded gray. Source: Treasury, Kim-Wright via FRED, NBER, and author’s calculations.
Hence, I join Cam Harvey (who brought to prominence the yield curve as recession predictor) who says it’s too early to drop the recession call.
More By This Author:
Russian Growth SlowsDot Plot Vs. Market Expectations
Is Velocity Stable?


