Danger: When A Classical Scholar(/Ideologue) Discusses Inflation
Victor Davis Hanson, writing in a data-free commentary published by the Independent Institute :
Inflation Is a Mere Construct
We used to know what inflation was, its pernicious role in past civilizations, and how to combat it. The danger of worthless currency is a staple of classical literature from Aristophanes to Procopius. The scary fact is not just that we are destroying the value of ourmoney—the exploding price of gas, food, appliances, lumber, power, and housing areoverwhelming even Joe Biden’s entitlement machine—but that we are constructing pseudoeconomics to justify the nihilism.
Right now, we witness a multitrillion-dollar fight over borrowing beyond our $30 trillion debtto build “infrastructure,” a word that has been expanded to include mostly anything but roads and bridges. What exactly is so liberal about the farmworker paying $5 a gallon forgas to commute to the fields, the small contractor doing a remodeling job with plywood at$80 a sheet, or the young couple whose loan qualification is always a month behind thesoaring price of a new home?
What the heck does he mean by “mere construct”? I think what he is alluding to is the following definition of a construct:
Social constructionism is a theory of knowledge in sociology and communication theory that examines the development of jointly constructed understandings of the world that form the basis for shared assumptions about reality. The theory centers on the notion that meanings are developed in coordination with others rather than separately within each individual.
Well, who am I to criticize this argument? — I only took one sociology course in college. But it sure sounds like he’s saying “inflation” is whatever he — and his friends — say it is. Nonetheless, I can talk about inflation as a technical term, from an economist’s perspective.
[As a side, I think Dr. Hanson is a bit behind the time…I price 4’x8′-1/2″ at about $48 at Home Depot, and EIA lists a gallon (all grades) at $3.15/gallon as of 7/19 — maybe Palo Alto is a bit pricier.]
Inflation is an increase in the price level. More specifically, let Pt be the price level (defined over some basket of goods). Then inflation is the percent growth rate of that price level,
πt ≡ [((Pt–Pt-1)/Pt-1)-1]x100%.
What does this construct look like in the United States over the two and a half years? Below I show the month-on-month annualized inflation rate (for data of monthly frequency, the calculation I use is πt ≡ [(Pt/Pt-1)12-1]x100%.

Figure 1: Month-on-month annualized inflation from CPI-all urban (blue), from personal consumption expenditure (PCE) deflator (black), chained CPI, nsa (brown), sticky price CPI (green), and 16% trimmed mean CPI (red). Seasonally adjusted Chained CPI calculated by author by applying arithmetic seasonal adjustment procedure to month-on-month log differences of n.s.a. Chained CPI. Source: BLS, Atlanta Fed, Cleveland Fed, via FRED, and author’s calculations.
And for the longer perspective:

Figure 2: Month-on-month annualized inflation from CPI-all urban (blue), from personal consumption expenditure (PCE) deflator (black), chained CPI, NSA (brown), sticky-price CPI (green), and 16% trimmed-mean CPI (red). Seasonally adjusted Chained CPI calculated by author by applying arithmetic seasonal adjustment procedure to month-on-month log differences of n.s.a. Chained CPI. Source: BLS, Atlanta Fed, Cleveland Fed, via FRED, and author’s calculations.
Survey-based expectations of inflation (12 months) are shown in this post. July nowcast for m/m inflation is quite low, as shown in yesterday’s post.
For those who are unable to interpret growth rates, here is a graph of the purchasing power of a single dollar spent in a US city, based on the CPI.

Figure 3: Purchasing Power of the Consumer Dollar in the U.S. City Average, 1982-84=100, on a log scale (blue). This is FRED series CUUR0000SA0R. Source: FRED.
One can readily see that the loss of currency purchasing power is not particularly marked in the last year.
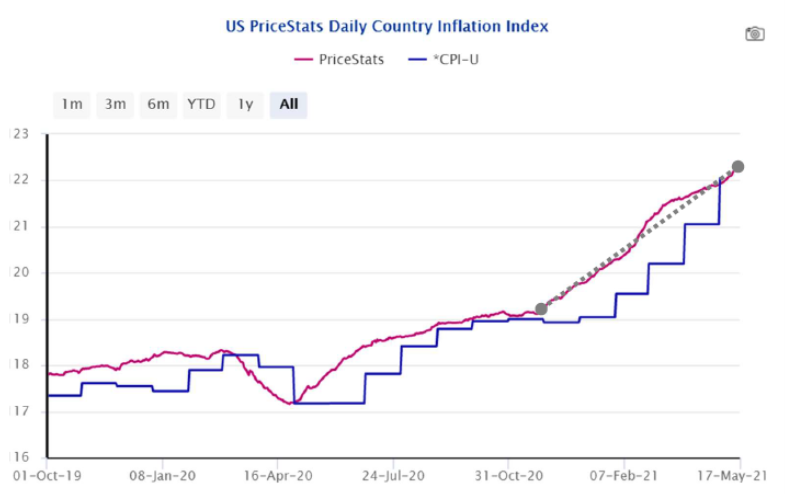
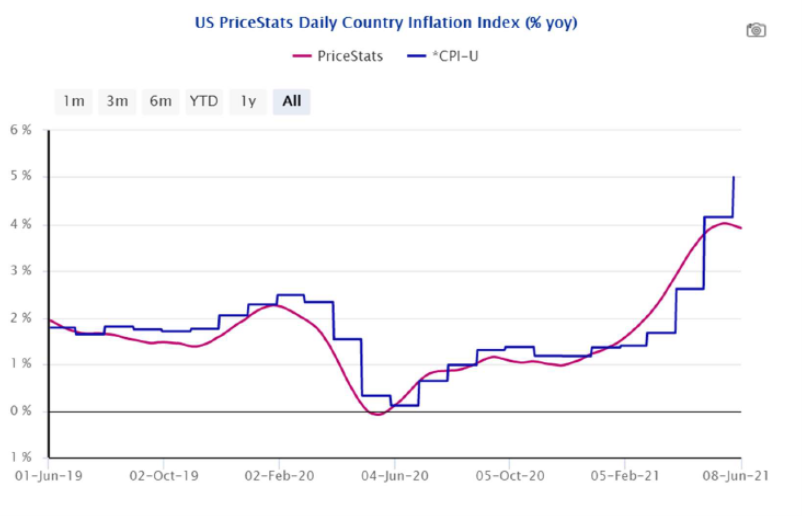
Finally, because no right-wing screed is complete without some conspiracy theory attached, I show an alternative price index (and corresponding inflation rate) based on online data, derived from the Billion Prices Project (described here by Jim), and drawn from an illuminating presentation by Alberto Cavallo at HBS. The blue line is the BLS series, the red PriceStats.

Source: Cavallo (June 2021).

Source: Cavallo (June 2021).
In other words, the CPI seems to not be too far off right now in terms of actual price developments that “people” face. (In this June 2021 presentation, he notes that while the CPI probably understated inflation in 2020, it probably overstates it in 2021.)
By the way, I don’t always disagree with Hanson. Here’s his last appearance in Econbrowser. To use a new-fangled phrase, perhaps he should “stay in his lane”. As for the Independent Institute, here is the last time a commentary from that organization showed up in Econbrowser.
Disclosure: None.


"Inflation" should be judged by the damage it does to those damaged by it. Some groups see no damage at all.
Really, inflation mostly hurts only those individuals who are not able to quickly and easily increase their incomes, or increase their savings accounts, to compensate for it. So it is only those groups that are damaged. The rest of the population can benefit from the reduction in purchasing power of their dollars.
If this explanation seems a bit cynical the interpretation is correct.
So the question becomes one of the relative importance of the two different population segments, and which segment one is in.