
USD Strength, Rising Yields Crush Stock Indices: Dax, Dow & FTSE Fall
Fed Commentary Sends Jitters Through Markets – US Dollar, Rising Yields Drive Stocks Lower
In the aftermath of the FOMC, equity futures have pulled back while US treasury yields and a stronger Dollar dominate. Ahead of the October NFP (non-farm payroll report) scheduled for release tomorrow, rising interest rates and a tight labor force have altered the forward guidance of the Federal Reserve.
Although the 75-bps Fed rate hike was in line with expectations, it was the accompanying press conference that drove Dow Jones (DJI), FTSE, and Dax into a sea of red.
With Fed Chair Jerome Powell reiterating the Central bank’s commitment to achieving the objectives of its dual mandate (full employment and price stability), expectations of higher rates for longer slashed hopes of a rate pivot in the foreseeable future.
Dow Jones Futures Slide - Wall Street Anticipates Higher Rates for Longer
As markets reacted to what turned into a more hawkish narrative than was initially expected, Dow Jones futures retreated from a high of 32273, before reaching a low of 31738 earlier today. While Wall Street stocks price in the revised expectations, a push below the daily low could drive DJI futures back toward the 50% retracement of the April – October move providing additional support at 31444.
Dow Jones Futures (DJI) Daily Chart
(Click on image to enlarge)
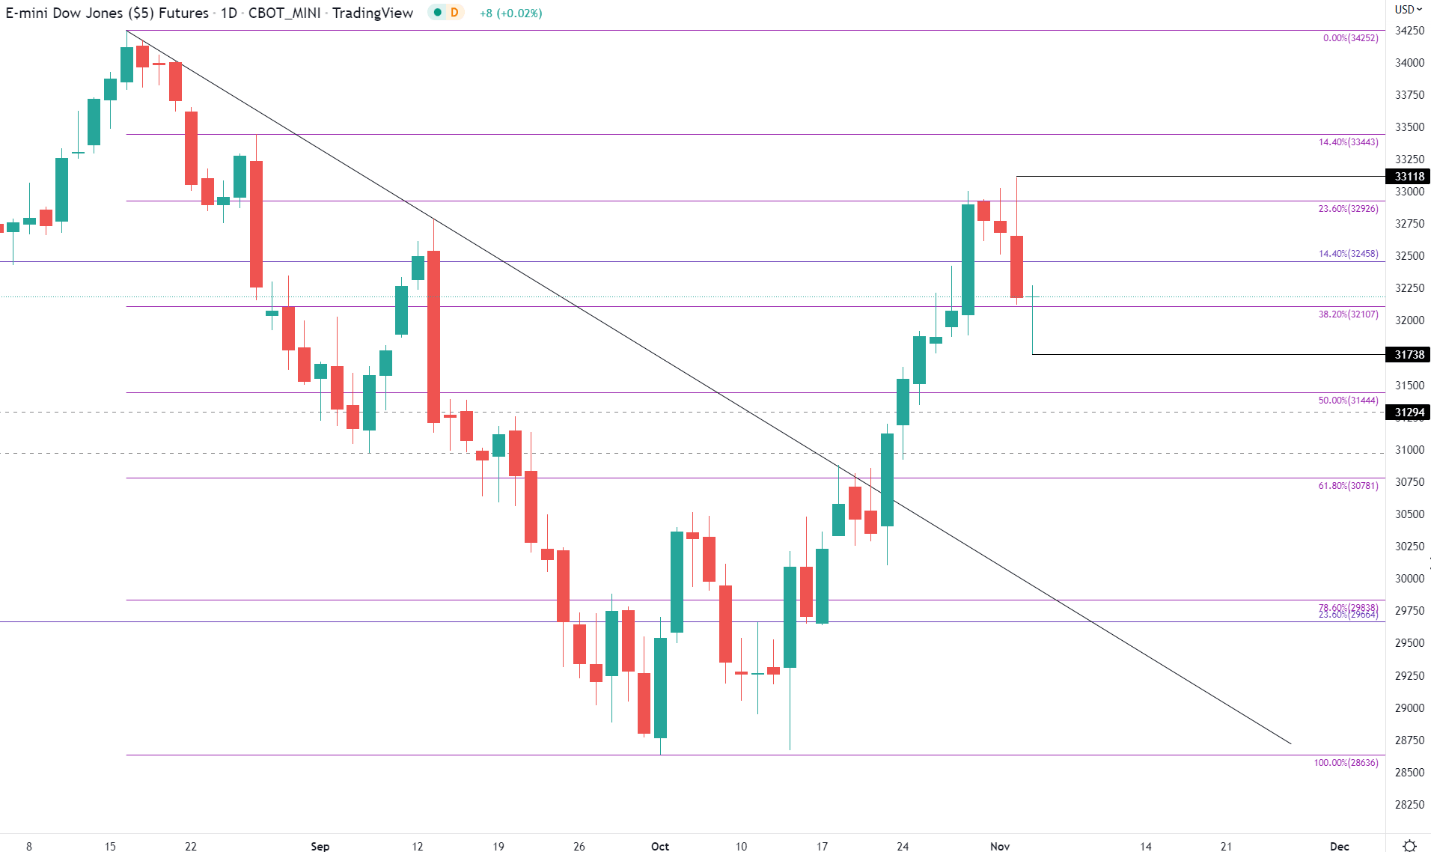
Chart prepared by Tammy Da Costa using TradingView
FTSE Price Action Whipsaws Between Psychological Support and Resistance
FTSE prices currently remain within the confines of psychological support and resistance, a break of 7000 and 7200 is required to drive price action out of the current range.
With the 7000 psychological handle proving resistance back in May of last year, its transition into support a month later has allowed it to limit the downward move on several occasions since.
As highlighted on the monthly chart below, this zone has become technically significant since. After successfully clearing this barrier in December, a strong rally drove FTSE prices higher before peaking at 7689.67 in Feb.
However, with a series of small-bodied candles and long wicks highlighting a fierce battle between bulls and bears, a rebound off the 7646 high in June allowed sellers to step in before stabilizing at that same 7000 level.
UK FTSE 100 Monthly Chart
(Click on image to enlarge)
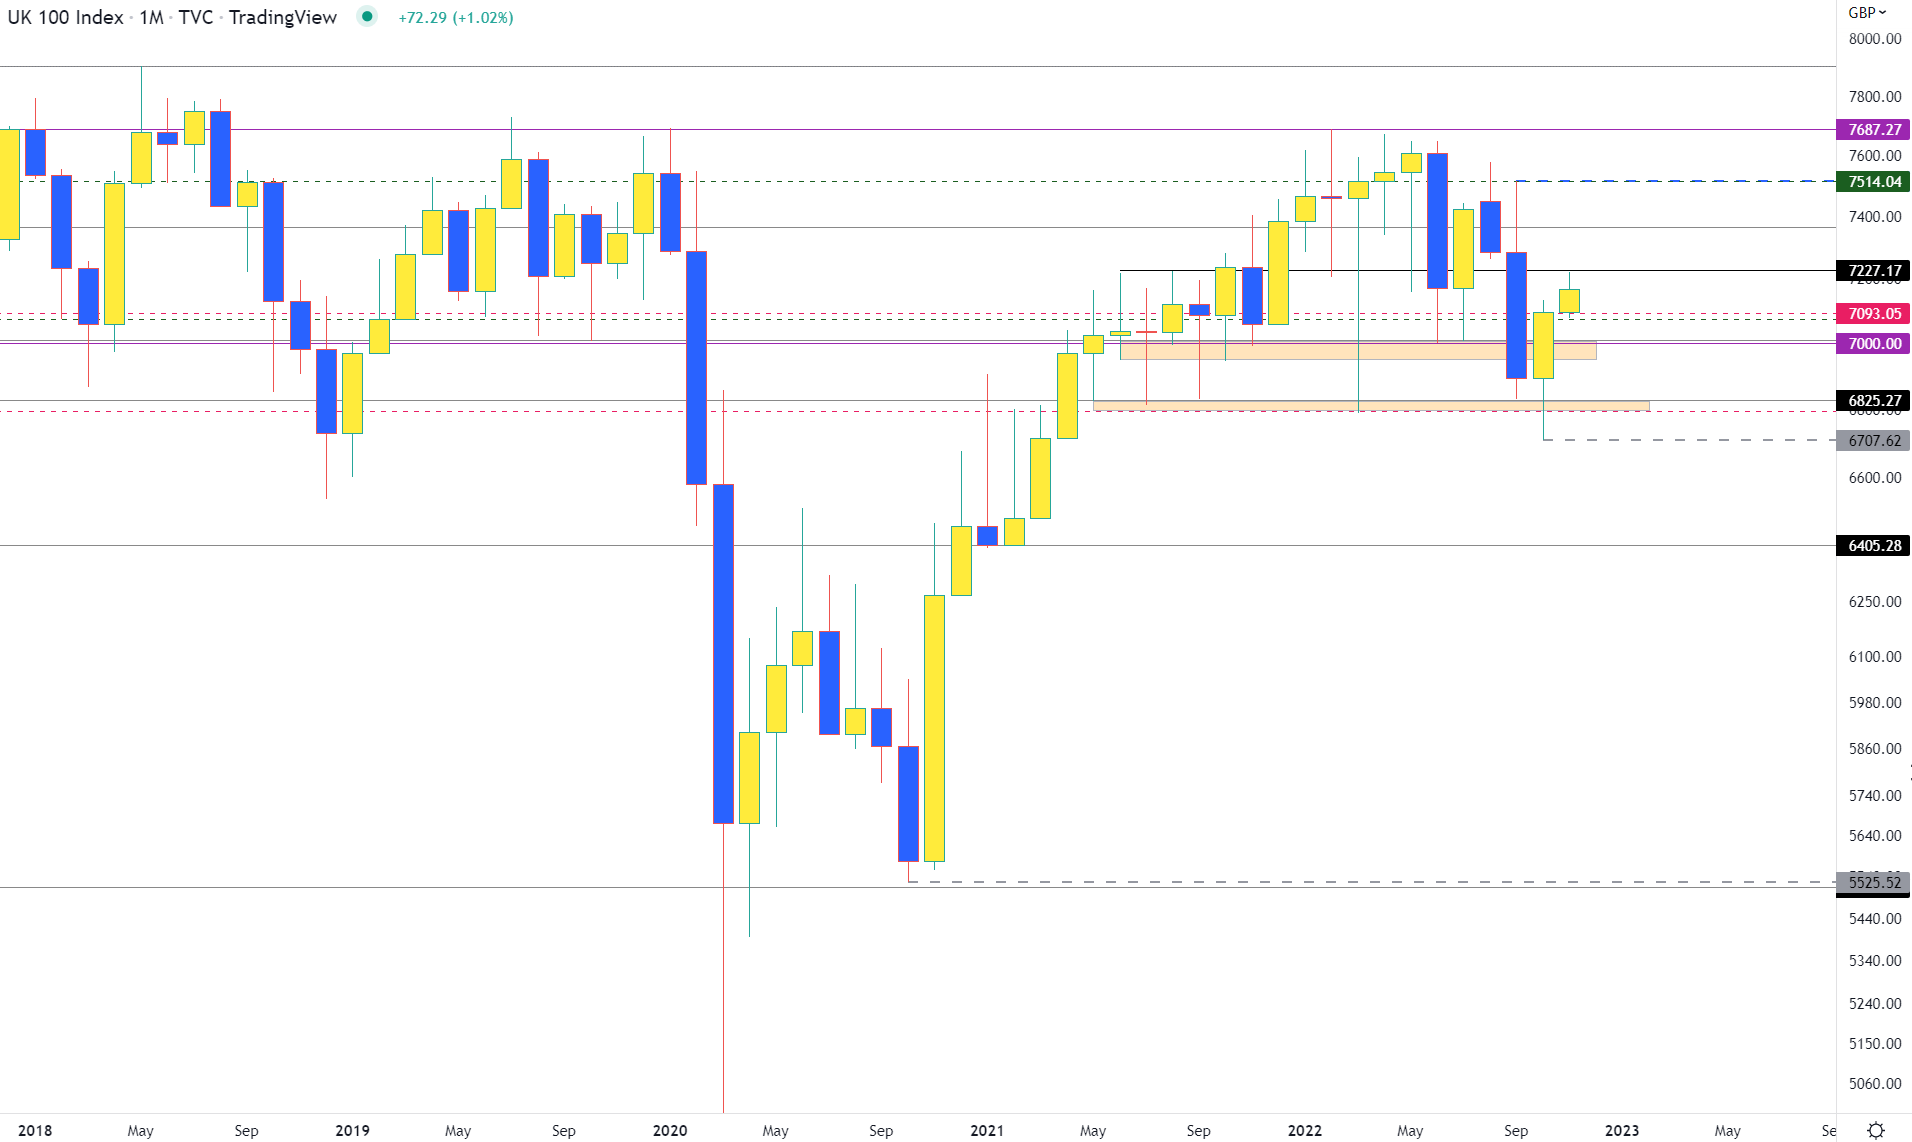
Chart prepared by Tammy Da Costa using TradingView
Similarly, the 7187 mark has recently provided additional resistance, just below another key layer of psychological resistance at 7200. After briefly retesting 7221 earlier this week and 7205 in yesterday’s session, a close above 7187 is necessary if bulls want to have a chance at driving the recovery higher.
FTSE 100 Daily Chart
(Click on image to enlarge)
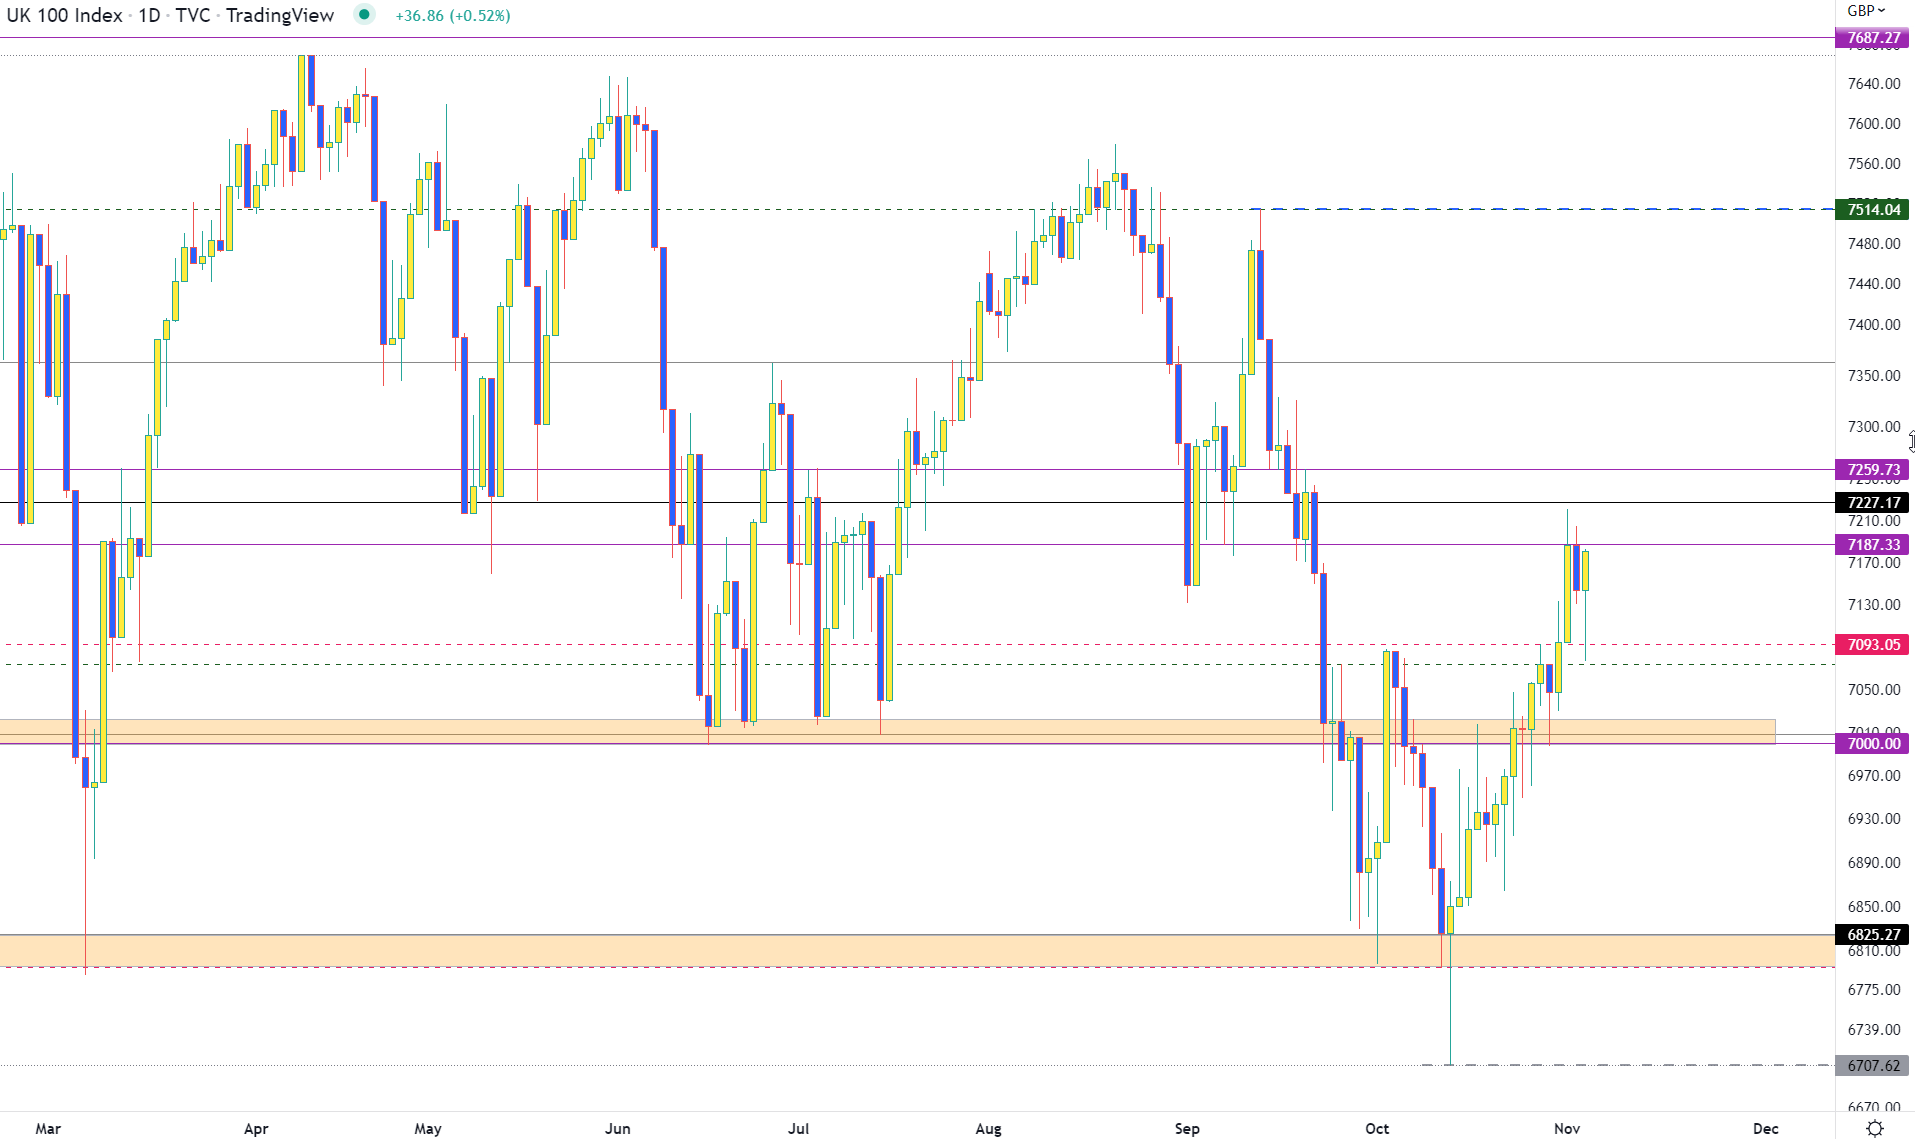
Chart prepared by Tammy Da Costa using TradingView
German Dax Dragged to Prior Trendline Resistance
Lastly, Dax futures have followed stock futures lower as the weekly candle pulls back toward the prior trendline resistance and turned support at around 13200. If prices continue to move lower, a break of 13000 could fuel additional losses with the next layer of support coming in at the prior week's low of 12
Dax Futures Weekly Chart
(Click on image to enlarge)
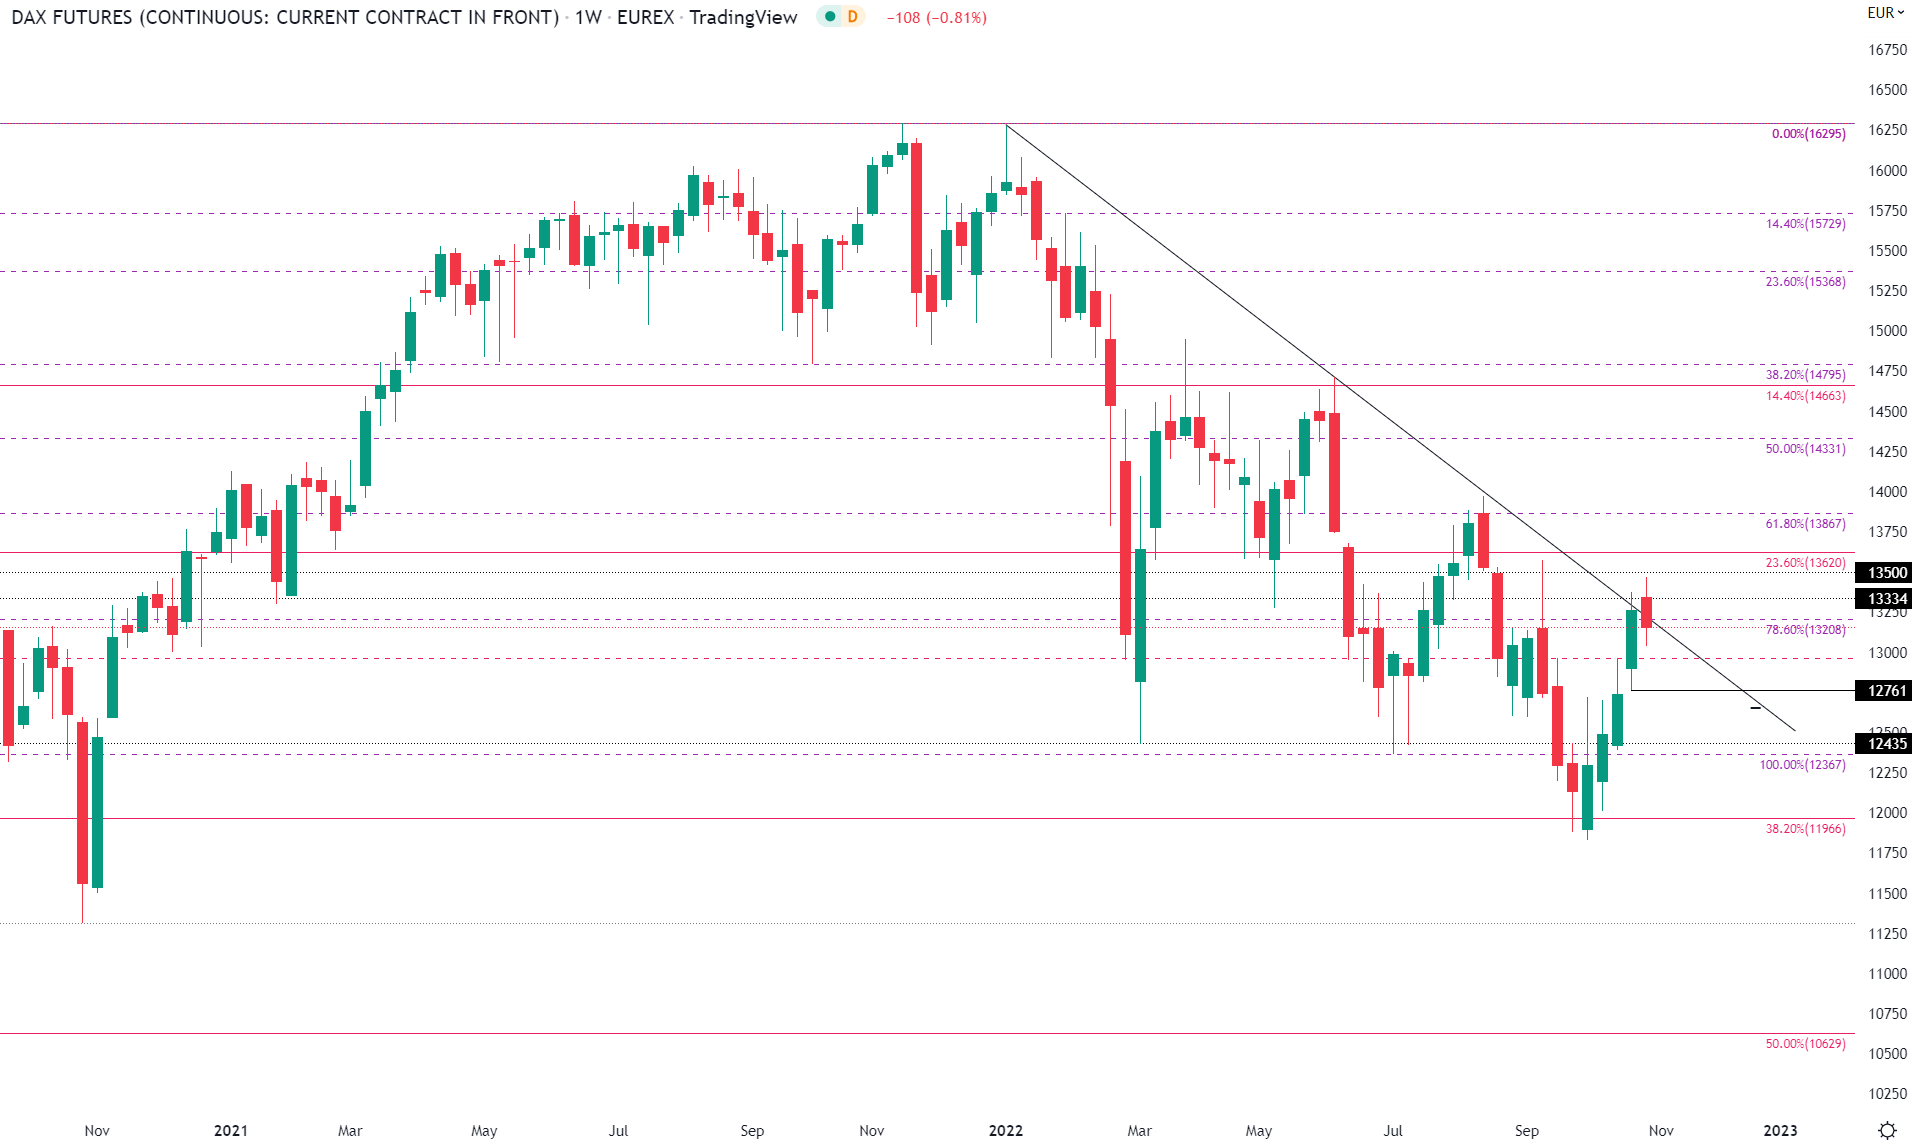
Chart prepared by Tammy Da Costa using TradingView
More By This Author:
FTSE 100 Pressurized By Resistance As The Fed Takes Center Stage
German DAX Breaks Major Resistance But Bullish Momentum Stalls
Bitcoin Prices Stumble Into Technical Support Ahead Of FOMC
Disclosure: DailyForex will not be held liable for any loss or damage resulting from reliance on the information contained within this website including market news, analysis, trading signals ...
more

