For most of 2022, the USD (DXY) king rocked, trending up by over 20%, defying gravity, and sporting the equivalent of portfolio “blue suede shoes” – while other major assets collapsed!
But market history teaches us that the strongest trends often give way to the greatest falls once they inevitably roll.
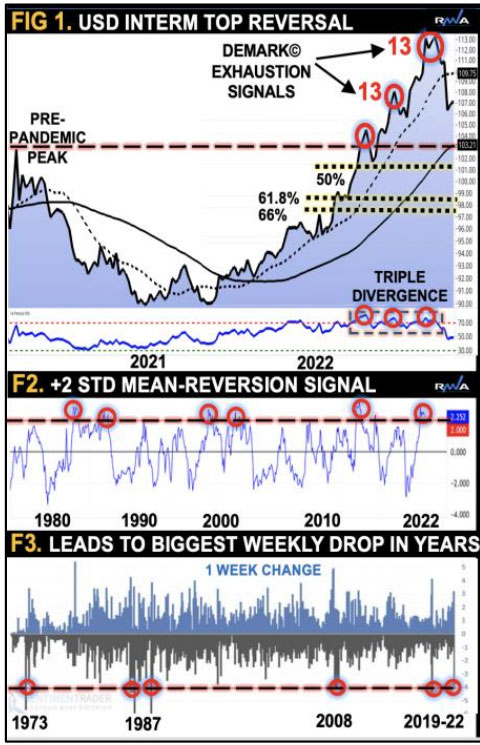
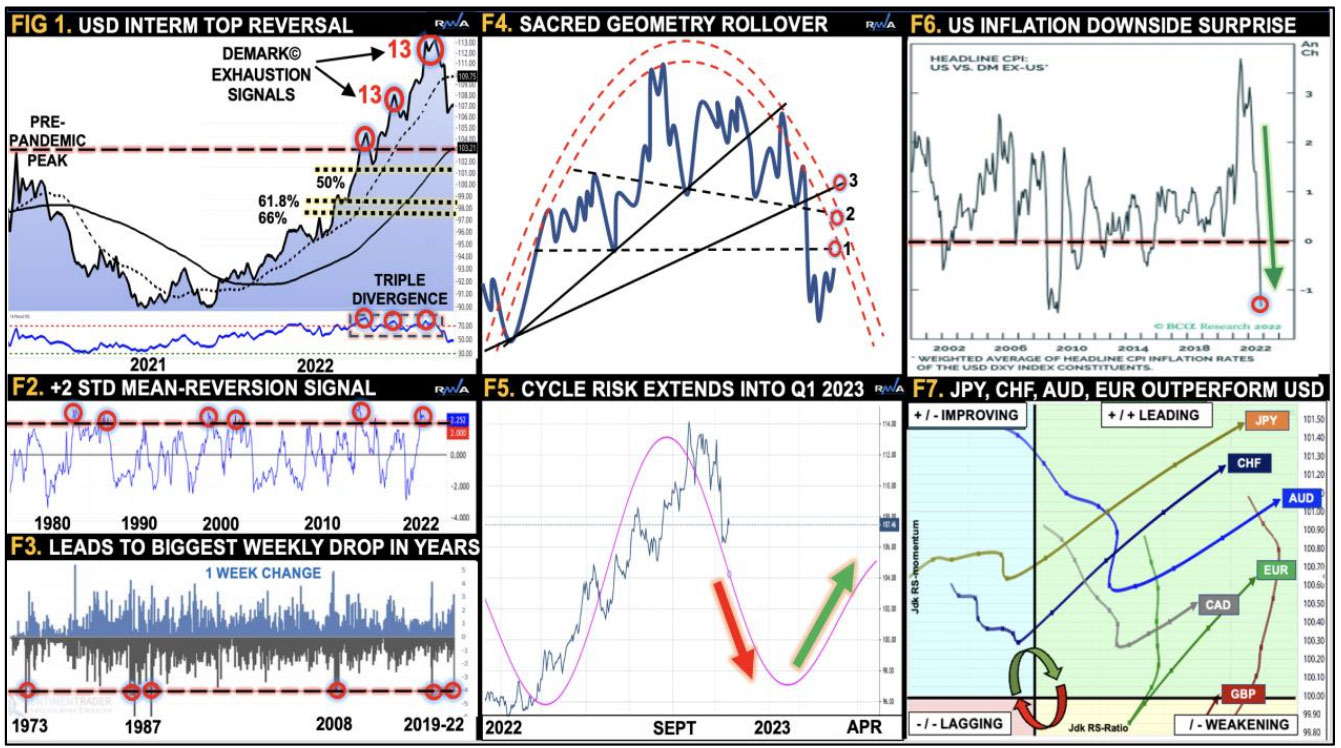
In a previous analysis, I shared three early warnings that led to a sizeable bull-trap capitulation, notably; DeMark© price exhaustion signals, momentum divergences (Figure 1), coupled with overcrowded positioning. In historical terms, this latest USD rock ‘n’ roll market dance was pivotal, having stretched by more than +2STD for only the sixth time in over 40 years (Figure 2)!
Consequentially, the price snapback led to one of the biggest weekly drops in years (Figure 3).

What next?
The USD’s behavioral pattern subconsciously traced out a sacred geometry which suggests a retest of point 1, 2 or 3, before rolling over once again into its pre-pandemic peak at 103 near 50% retrace at 102.30 (Figure 4).
One of our cycle models, based on spectral analysis, correctly predicted the USD downturn into year-end. It now extrapolates to Q1 2023 (Figure 5). Thereafter, a viable USD relief-rally is expected, likely fueled by renewed safe-haven flows as global sentiment turns back to risk-off mode in-line with our composite cycle work.
From a macro perspective, the USD shakeout followed US inflation surprises to the downside which is best seen as a weighted average of headline CPI inflation rates of the USD DXY constituents (Figure 6).
This requires two pillars – a growth rotation from the US towards other economies and inflation to subside much faster abroad. We continue to predict a new market regime for inflation and rates, “characterized by waves of volatility with a tentative high-low watermark [on US10YR] of 5% to 3%.”
Currently, rates have also carved an interim top, temporarily reversing to the lower boundary. Meanwhile, the decline in DXY is broadening, with major currencies such as JPY, CHF, AUD, and EUR unwinding from oversold conditions (Figure 7).
(Click on image to enlarge)

More By This Author:
The Most Popular Stocks Millennial And Gen-Z Are Investing In
SP500 Double Bottom or Market Mirage?
Using Breadth Indicators To Forecast The Markets
Disclosure: Financial Markets Risk Warning
U.S. Government Required Disclaimer - Commodity Futures Trading Commission Futures and Options trading has large potential rewards, but also large ...
more
Disclosure: Financial Markets Risk Warning
U.S. Government Required Disclaimer - Commodity Futures Trading Commission Futures and Options trading has large potential rewards, but also large potential risk. You must be aware of the risks and be willing to accept them in order to invest in the futures and options markets. Don't trade with money you can't afford to lose. This is neither a solicitation nor an offer to Buy/Sell futures or options. No representation is being made that any account will or is likely to achieve profits or losses similar to those discussed on this web site. The past performance of any trading system or methodology is not necessarily indicative of future results.
CFTC RULE 4.41 - HYPOTHETICAL OR SIMULATED PERFORMANCE RESULTS HAVE CERTAIN LIMITATIONS. UNLIKE AN ACTUAL PERFORMANCE RECORD, SIMULATED RESULTS DO NOT REPRESENT ACTUAL TRADING. ALSO, SINCE THE TRADES HAVE NOT BEEN EXECUTED, THE RESULTS MAY HAVE UNDER-OR-OVER COMPENSATED FOR THE IMPACT, IF ANY, OF CERTAIN MARKET FACTORS, SUCH AS LACK OF LIQUIDITY. SIMULATED TRADING PROGRAMS IN GENERAL ARE ALSO SUBJECT TO THE FACT THAT THEY ARE DESIGNED WITH THE BENEFIT OF HINDSIGHT. NO REPRESENTATION IS BEING MADE THAT ANY ACCOUNT WILL OR IS LIKELY TO ACHIEVE PROFIT OR LOSSES SIMILAR TO THOSE SHOWN.
No representation is being made that any account will or is likely to achieve profits or losses similar to those shown. In fact, there are frequently sharp differences between hypothetical performance results and the actual results subsequently achieved by any particular trading program. Hypothetical trading does not involve financial risk, and no hypothetical trading record can completely account for the impact of financial risk in actual trading.
All information on this website is for educational purposes. Any statements about profits or income, expressed or implied, does not represent a guarantee. Your actual trading may result in losses as no trading system is guaranteed. You accept full responsibility for your actions, trades, profit or loss, and agree to hold Invest2Success and any authorized distributors of this information harmless in any and all ways.
All rights reserved. The use of this website constitutes acceptance of our user agreement.
Financial Products Services Disclosure
Invest2Success is partnered with and advertises promotes other companies finanical products and services, as well as our own. As such, Invest2Success receives advertising promotion compensation from these other companies in doing so. Invest2Success believes the products services of our own and other compaines listed on our site and blog are very unique and can be beneficial to investors traders because they meet our quality guidelines for good investing trading methods which investors traders can use to help improve their financial education knowledge and investing trading results. We do not warrant and are not liable for any claims or testimonies made by these other compaines products and services. Review each product and service carefully before purchasing and using. The purchase, use, and results of any of the products services on our website and blog is sole responsibilty of the user.
less
How did you like this article? Let us know so we can better customize your reading experience.


