
Double Bottom Déjà vu? Or…Just a Mirage?
Every single person who knows I am a market watcher has asked me the same question for the last two weeks.
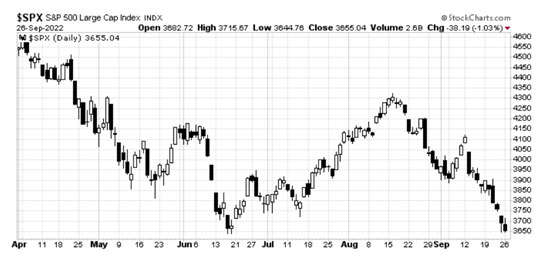
This past Monday (September 26th, 2022), I was asked at least three times as often. In fairness, the S&P 500 Index chart that many of them were looking at does beg this question. And on Monday, the market closed with the most crystal clear setup I’ve seen in a long time:
(Click on image to enlarge)
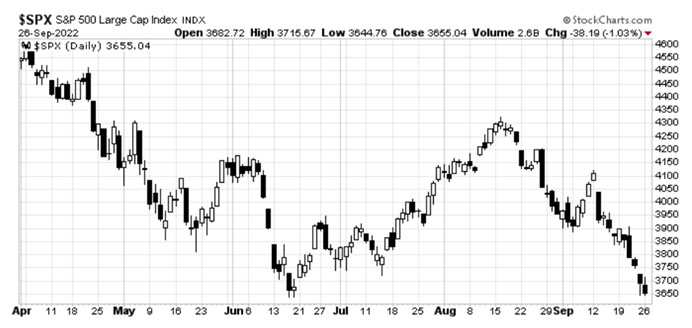
Without any markup from me at all, this chart has the clearest: 1) Start of a Double Bottom setup and 2) Multi-month channel that I have seen on a major index in decades (more on that below).
Just in case you’d like me to mark that up, let’s take a look:
(Click on image to enlarge)
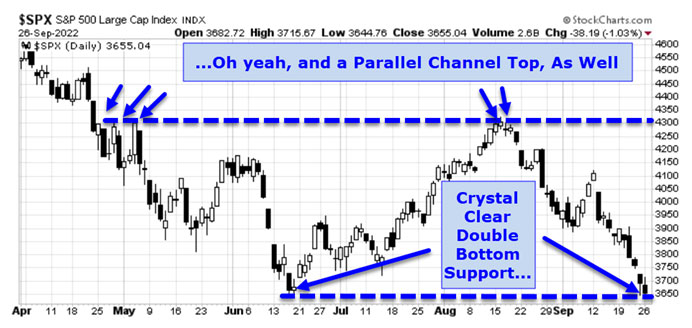
This is the start of the Double Bottom setup. Edwards & Magee or Richard Schabacker would require lots of confirmation to complete the setup. But, for now, that’s just a work of art! And given today’s extreme market volatility, that could be violated in a morning of trading…
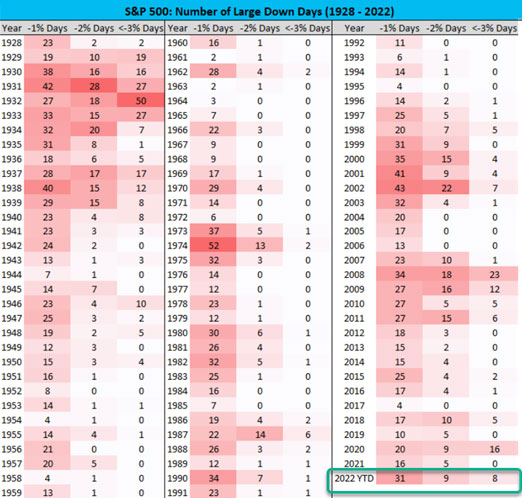
Because, we’ve had an astonishing 31 trading days where the S&P has dropped between -1% and -2%. That’s more in just under nine months than we’ve had in any full year since 2008. We had an additional nine days with drops between -2% and -3% and yet another eight days with drops greater than -3%.
Those numbers, courtesy of Compound Advisors:
(Click on image to enlarge)
Those of you who are market historians will enjoy this chart comparison below because the setup is strangely similar to almost exactly 20 years ago. The top chart is from 2002 and the chart immediately below is the exact same chart from the top of the article:
(Click on image to enlarge)
(Click on image to enlarge)
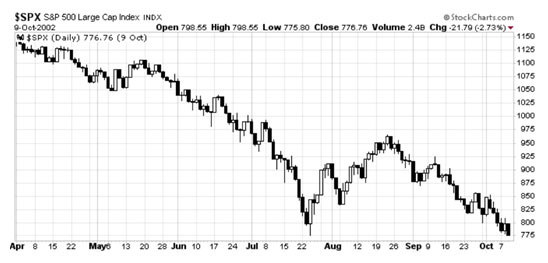
And here’s what happened back in 2002 after the support level/double was hit:
(Click on image to enlarge)
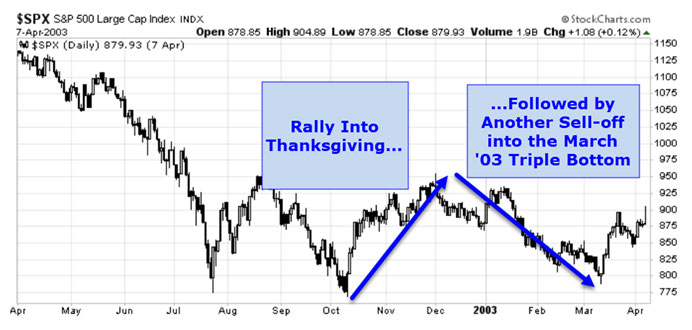
The recent market action in 2022 and the late stages of the Dot.Com crash have shown some similarities for a few months, but there are few other direct similarities in the macro-economic picture and the Fed action in the two eras. And, remember that the 2002 action came almost two and a half years after the start of the Dot.Com cliff dive. I’m certainly not suggesting a double is starting here but that is certainly one of the technical analysis scenarios that’s in play. In a future article, we’ll look at some signposts that might make for a tradeable Double Bottom. Or, for the possibility that the support level is violated.
More By This Author:
Using Breadth Indicators To Forecast The MarketsDealing with Different Market Forecasts and Opinions
The Coronavirus and the Shanghai Composite Index Price Forecast


Comments
Log in or sign up to join the conversation.