
Oil’s Fall Is Temporary
In this week’s Dirty Dozen [CHART PACK], we look at seasonality cycle composites, Bull regimes in Europe, check in on EURUSD and crude, then go through sector valuations and pitch an E&P play that’s coiled and looking ready to run, plus more…
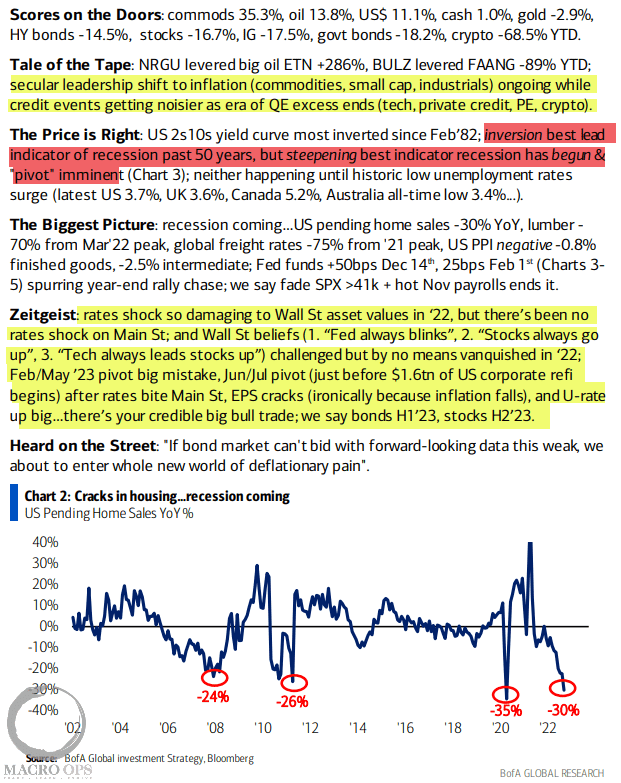
- The latest BofA Flow Show summary with highlights from me.
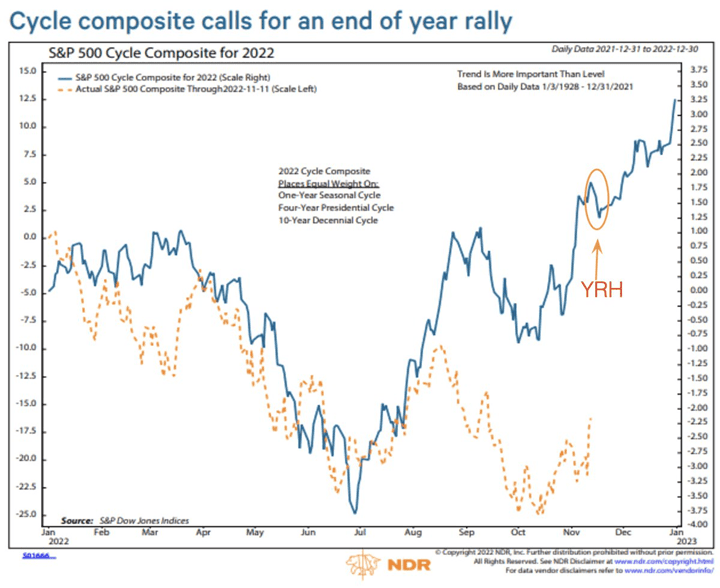
- The market continues to follow its 2022 cycle composite fairly closely. Note it’s the trend and not the level that’s important here. Seasonals support a strong advance into year’s end (h/t @SethCL).
(Click on image to enlarge)
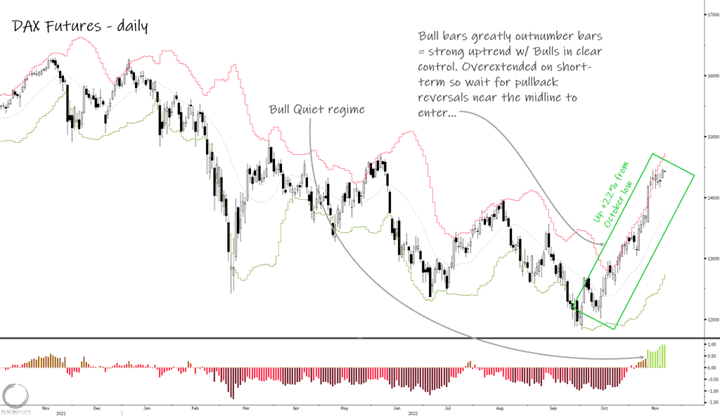
- If you’re looking for opportunities to buy the dip and play this bear market rally, then you could do worse than the German DAX. The DAX flipped into a Bull Quiet regime earlier this month and is up 22% since the October lows, far outpacing the gains made by major US indices.
With the potential for a Ukraine/Russian ceasefire on the horizon, there’s increasing catalysts to drive this move a good deal further.
(Click on image to enlarge)
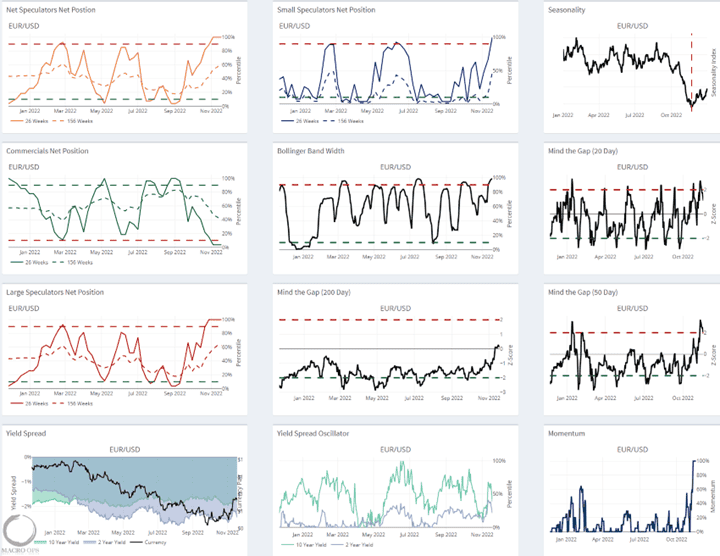
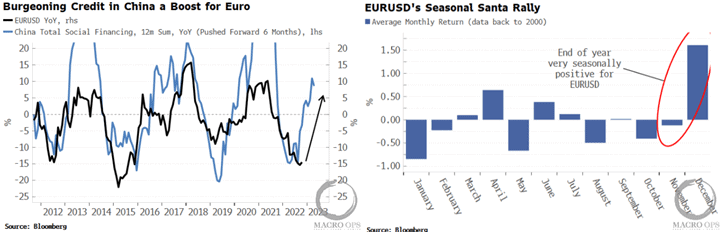
- A number of you have asked my thoughts on the EURUSD. Looking at our HUD (Head’s Up Display) chart matrix, it shows the pair is around 2std above its 20 and 50-day moving averages. This means further mean reversion lower is likely over the very short term.
Speculative positioning is also starting to get a little long in the tooth but isn’t yet at levels that mark a contra turning point. Longer-term though, yield spreads and spread momentum aren’t great for EURUSD, so I expect we see the pair chop sideways for a few months until that changes.
(Click on image to enlarge)
- On the positive side, EURUSD will benefit from Chinese reopening and improving credit dynamics. And importantly, end-of-year seasonality is a strong tailwind for the pair (via BBG).
(Click on image to enlarge)
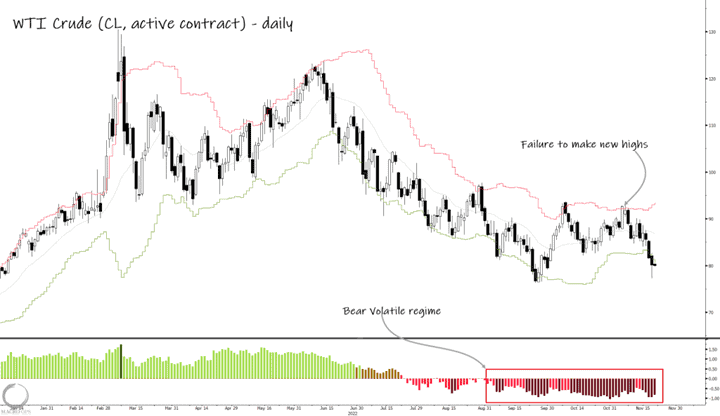
- Crude oil is breaking out lower from its recent range. The Texas Tea is in a Bear Volatile regime after recently failing to take out its last pivot high.
From a pure price action perspective, this is to be expected if you pull back and look at the monthly chart. Crude put in four consecutive monthly bear bars followed by a very weak bull bar (candle closed below its middle) in October. So it’s typical to see another leg down (a 1-2 correction) before the uptrend continues, though I expect this leg lower to be much shorter.
(Click on image to enlarge)
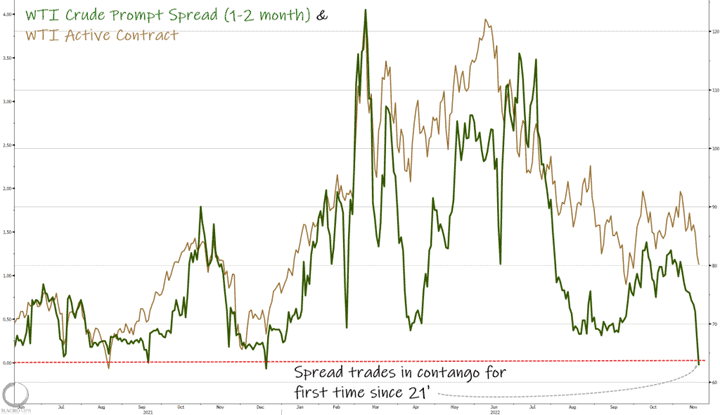
- Via BBG “Front-month spreads on West Texas Intermediate crude oil flipped into contango for the first time today since 2021, showing that demand is falling faster than OPEC+ cuts production.
“The move can be short-lived if OPEC+ decides to cut more when it meets on Dec 5. The forward oil curve has been telling us about weakening demand since early Nov, but some traders explain today’s flip into contango by additional supply coming as a result of a reduced capacity of Shell’s Zydeco oi pipeline… A disruption that is causing shale barrels moving to Cushing for storage, which affects near-term WTI contracts.”
(Click on image to enlarge)
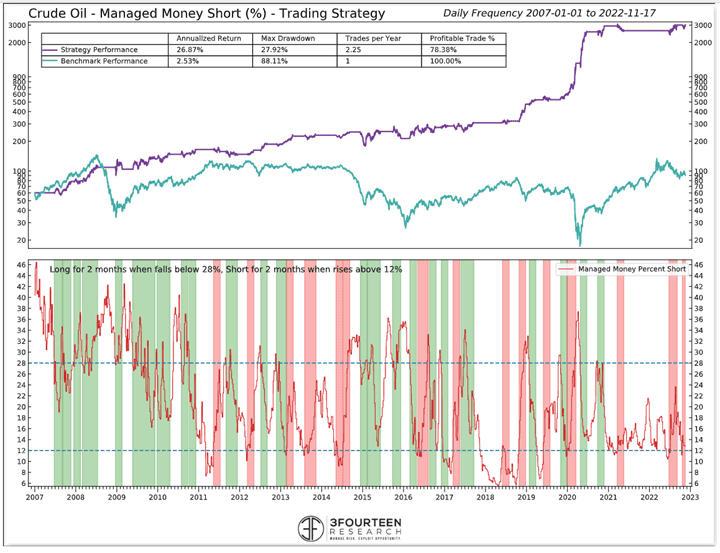
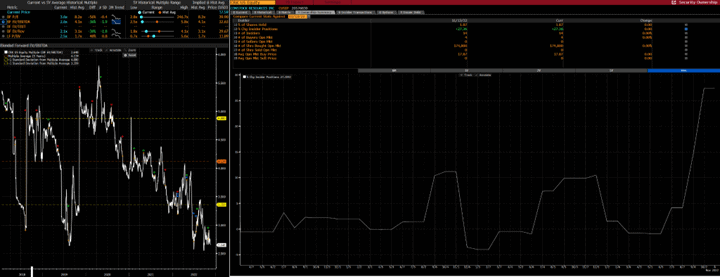
- @WarrenPies suggests this is largely a positioning unwind, writing:
What happened to oil this week?
Hedge funds/CTAs had once again gotten too bullish.
Once those positions begin unwinding, oil rarely performs well in the short term.
Our Managed Money short positioning indicator picked this up a couple weeks ago.
(Click on image to enlarge)
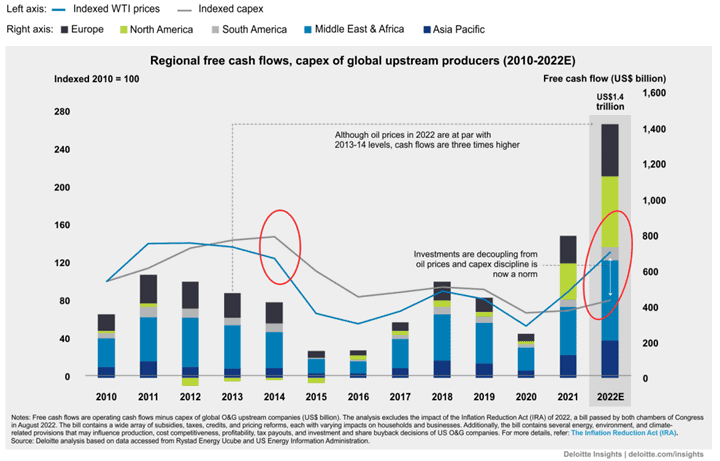
- But it’s always good to pull out and see the big picture sans positioning-driven moves. And here, things still look incredibly bullish. Deloitte’s 2023 Oil and Gas Industry Outlook “estimates that the global upstream oil and gas industry could generate a record annual free cash flow of $1.4 trillion in 2022, more than triple the level at the beginning of the oil-price crash in 2014. Yet, while the indexed oil price (blue line) exceeds the 2014 level, the indexed capex (gray line) stands at barely above half of its 2014 level. This suggests that the energy crisis will only get worse before it gets better.”
You can read our long-term bull thesis on oil here.
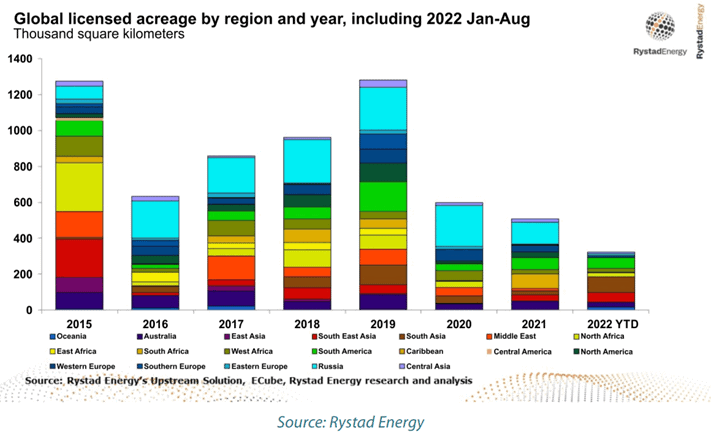
- This graph from Rystad Energy shows global licensed acreage by region and year. This year is running well below the average over the last seven.
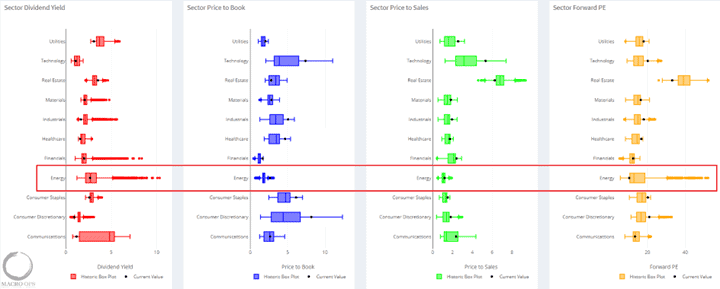
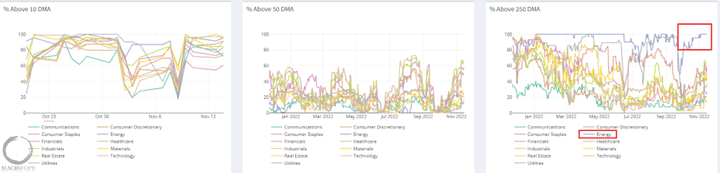
- The Sector tab on our HUD shows that despite the monster rally in energy this year, it’s still incredibly cheap relative to other sectors and to its own 20-year history. While the sector enjoys the strongest long-term breadth out of the bunch (lower right-hand chart).
(Click on image to enlarge)
(Click on image to enlarge)
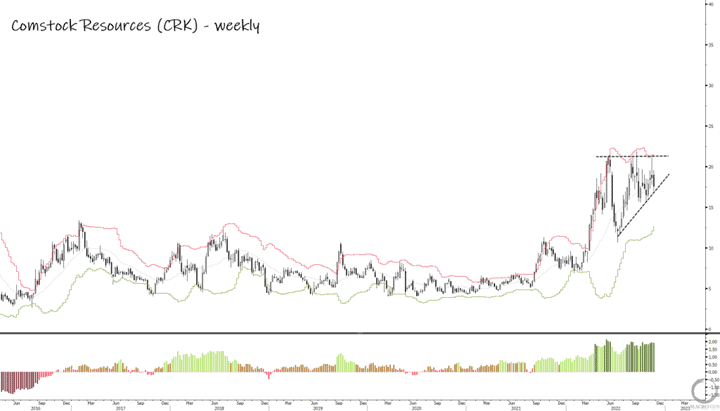
- One E&P we own is Comstock Resources (CRK). It has one of the best momentum profiles of all US producers. It’s incredibly cheap on both a relative and absolute basis. And insiders have been loading up on stock over the past few months.
The stock is wedging on the weekly chart, compressing and building energy for the next leg up.
(Click on image to enlarge)
(Click on image to enlarge)
More By This Author:
Homebuilders Are Set To Rise
Small-Caps Set To Sizzle
A BIG Trend Is Brewing
Disclaimer: All statements are solely opinions and are for educational purposes only.


