GBP/USD Forex Signal: Wedge Pattern Points To More Downside
Bearish view
- Sell the GBP/USD pair and set a take-profit at 1.2825.
- Add a stop-loss at 1.3100.
- Timeline: 1-2 days.
Bullish view
- Buy the GBP/USD pair and set a take-profit at 1.3100.
- Add a stop-loss at 1.2825.
(Click on image to enlarge)
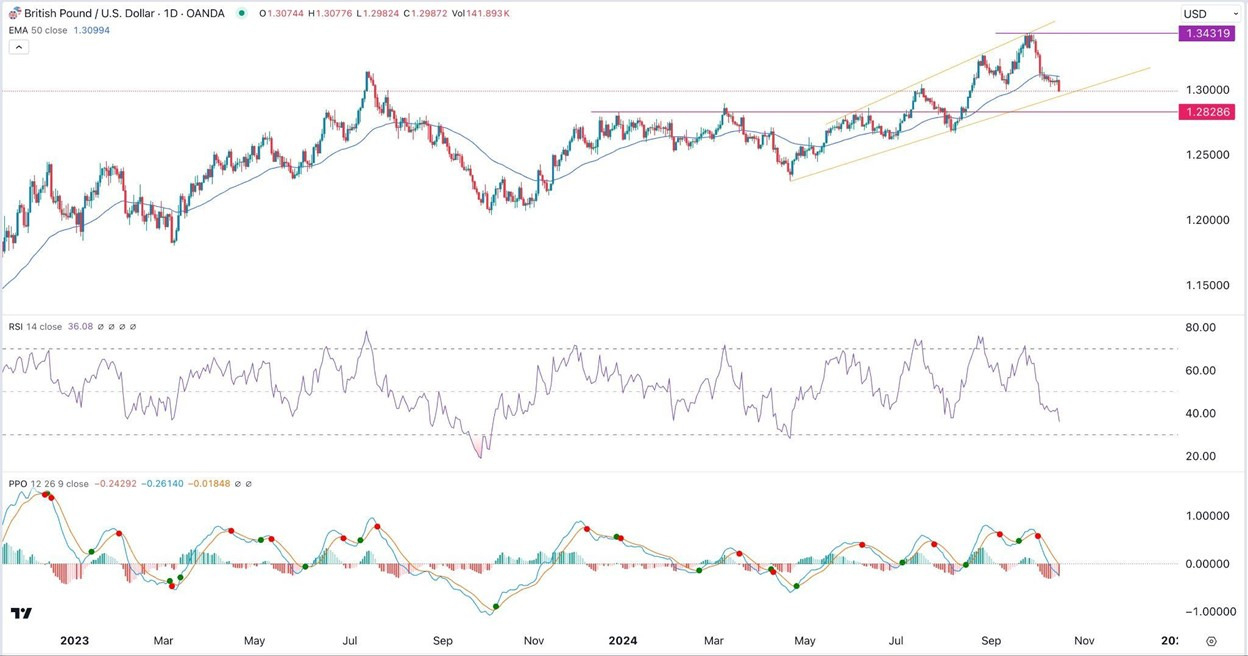
The GBP/USD exchange rate continued its downward trend, falling to its lowest point since August 22nd, and by over 3.35% from its highest level this year. The plunge happened as the US dollar index rose by over 0.30% to $103.35, while UK inflation retreated.
UK consumer inflation
The GBP/USD pair continued falling after UK published encouraging consumer and producer inflation data.
According to the Office of National Statistics (ONS), the headline CPI dropped from 0.3% in August to 0.0% in September. The figure retreated from 2.2% to 1.7% on a year-on-year basis, moving below the BoE’s target of 2.0%.
Core inflation, on the other hand, which excludes the volatile food and energy prices, dropped from 0.4% to 0.1% in September. It also fell from 3.6% to 3.2% on an annual basis, meaning that it is moving in the right direction.
The producer price index (PPI) input dropped by 2.3%, while the output figure fell by 0.7%. Another report showed that the retail price index (RPI) dropped from 3.5% to 2.7%.
The data came a day after the UK published encouraging jobs numbers. The report revealed that the unemployment rate dropped from 4.1% in July to 4.0%, while the average earnings retreated.
Therefore, the GBP/USD pair dropped as investors anticipated that the Bank of England (BoE) will restart cutting interest rates in the next meeting. It has already slashed rates by 0.25% to 5.0%, and analysts see it cutting by 0.25% or 0.50% in the next meeting.
The next key catalyst for the pair will be the US retail sales data and Philadelphia Fed manufacturing index. These numbers will help the Fed when delivering its interest rate decision.
GBP/USD technical analysis
The GBP/USD pair has been in a strong downward trend after peaking at 1.3431 in September. It has retreated below the 50-day Exponential Moving Average (EMA).
The pair has also formed a rising broadening wedge, which is a popular bearish reversal sign. Also, the Relative Strength Index (RSI) has moved below 50, and is nearing oversold level of 30.
The Percentage Price Oscillator (PPO) has moved below the zero line. Therefore, the pair will likely continue falling as bears target the next point at 1.2828, its highest swing on December 28.
More By This Author:
AUD/USD Forex Signal: Bears Prevail Ahead Of US Retail Sales DataBTC/USD Signal: Bitcoin Price Rally Gains Steam
EUR/USD Forex Signal: Euro Pummeled Ahead Of ECB Decision
Disclosure: DailyForex will not be held liable for any loss or damage resulting from reliance on the information contained within this website including market news, analysis, trading signals ...
more


