BTC/USD Signal: Bitcoin Price Rally Gains Steam
Bullish view
- Buy the BTC/USD pair and set a take-profit at 72,000.
- Add a stop-loss at 65,000.
- Timeline: 1-2 days.
Bearish view
- Sell the BTC/USD pair and set a take-profit at 65,000.
- Add a stop-loss at 72,000.
(Click on image to enlarge)
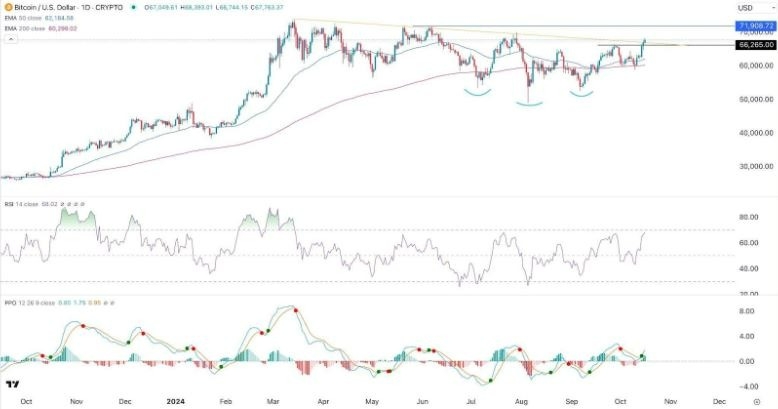
Bitcoin continued its strong uptrend as the crypto fear and greed index rose to the greed zone of 60. The BTC/USD soared to the important resistance point at 68,000, its highest level since July, and a few points below its all-time high of 73,800. It has also soared by almost 38% from its lowest level in August.
Bitcoin’s surge continued as a risk-on sentiment among investors continued. US equities rose, with the Dow Jones, S&P 500, and Nasdaq 100 indices rose by 0.80%, and are hovering at their highest level on record.
The BTC/USD pair rose even as the US dollar index continued its uptrend, reaching a high of $103.70. The greenback has jumped by over 3% from its lowest point this year as odds of the Federal Reserve maintaining a hawkish tone for a while.
The pair rose as odds of Donald Trump winning the next general election in November. Data by Polymarket shows that Trump has a 59% chance of winning the general election compared to Kamala Harris.
Donald Trump is seen as the favorite president for the crypto industry because he is a big player in the sector. He owns cryptocurrencies valued at over $6 million and is launching the World Liberty Financial, a crypto project.
He is also seen as a better president because of his policies. He has promoted tariffs and tax cuts, which analysts believe will lead to more budget deficit at a time when the US debt has jumped to over $35.5 trillion. A recent study estimates that his policies will lead to over $7.5 trillion in the next decade.
BTC/USD Technical Analysis
The BTC/USD pair has been in a strong bullish trend in the past few days. It rose and crossed the important resistance point at 66,265, its highest point in September.
It has risen above the descending trendline that connects the highest swings since March this year, when it peaked at 73,800.
The pair has formed an inverse head and shoulders pattern, a popular bullish sign. Also, it has risen above the 50-day and 200-day Exponential Moving Averages (EMA).
Also, the Relative Strength Index (RSI) and the Percentage Price Oscillator (PPO) have risen. Therefore, the pair will likely continue rising as bulls target the next point at 72,000, its highest point on June 7.
More By This Author:
EUR/USD Forex Signal: Euro Pummeled Ahead Of ECB DecisionAUD/USD Forex Signal - Bearish Flag Pattern Points To More Downside
BTC/USD Forex Signal. Inverse Head And Shoulders Forms
Disclosure: DailyForex will not be held liable for any loss or damage resulting from reliance on the information contained within this website including market news, analysis, trading signals ...
more


