
EUR/USD Weekly Forex Forecast For April 20 – 24, 2020
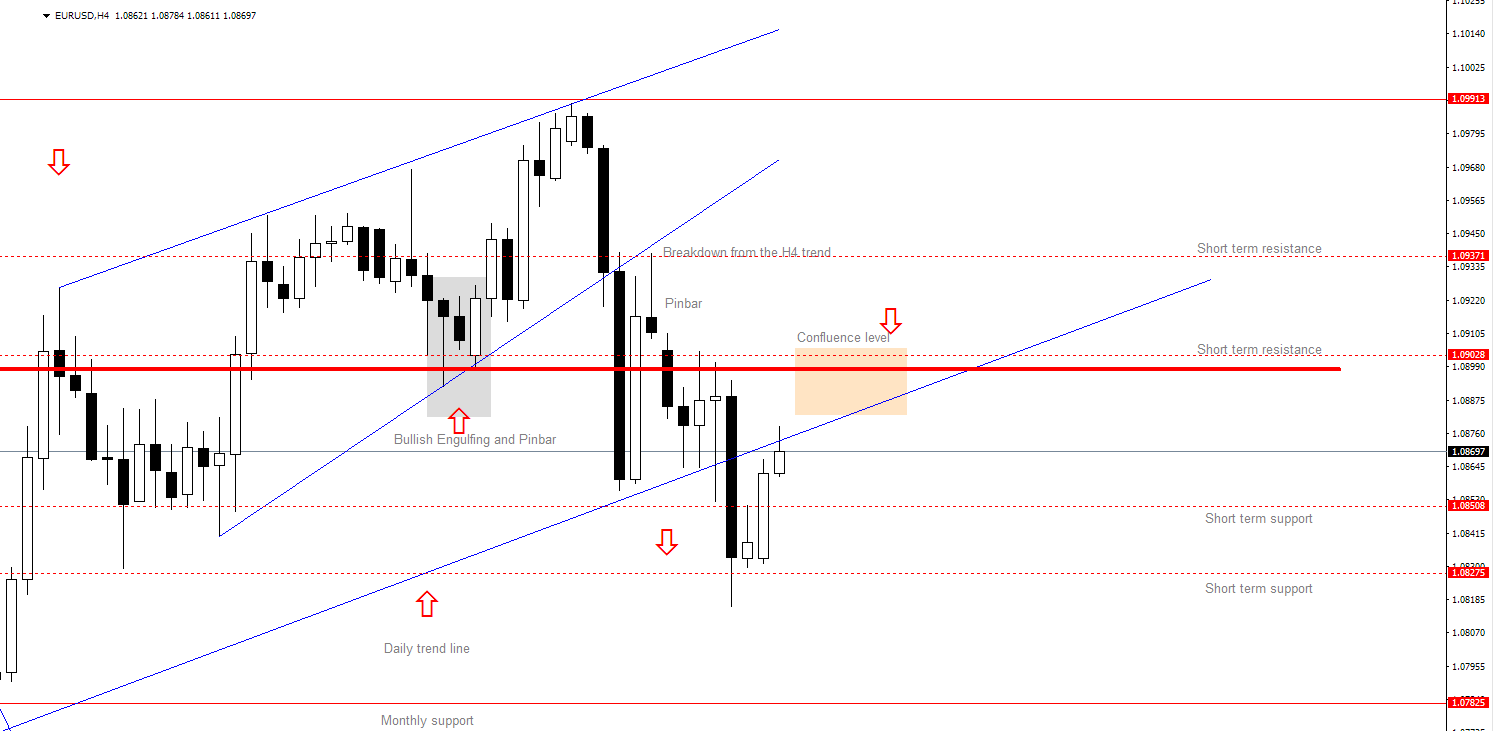
I have been talking about possible pullback from 1.08275 to the confluence level where we could wait for the bearish price action which would point price moving down towards 1.08275.
(Click on image to enlarge)
What happened?
Price have pulled back and did not break up above daily trendline and 1.09028 level which could suggest that the price could try to reach 1.09913. The 1.09913 level is the high of the previous week.
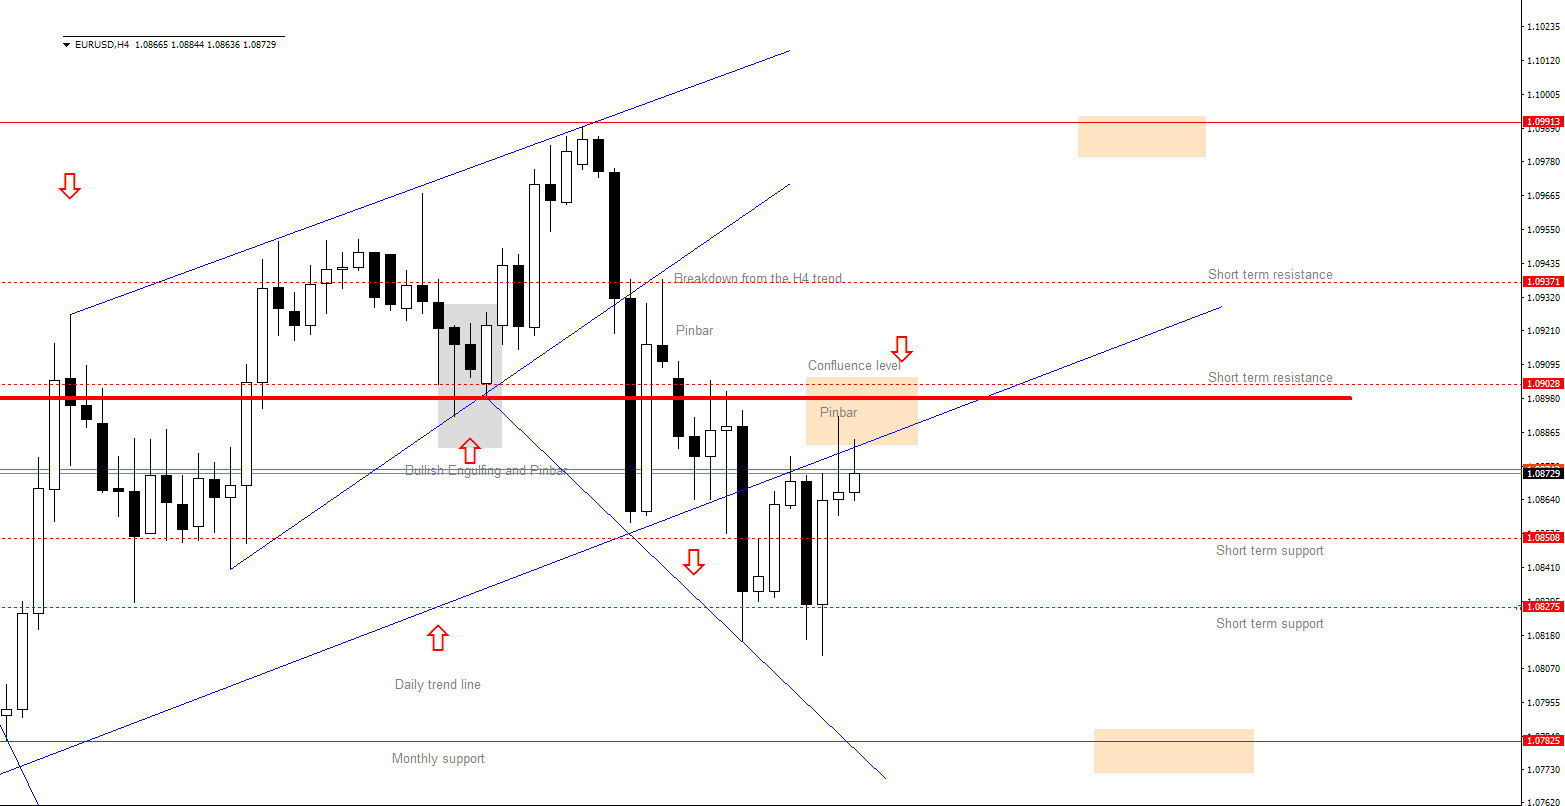
The confluence level between 1.08508 and 1.09028 has served as an area where the price have managed to form a pin bar on H4 which suggest us that we could see potential move down and run for 1.07825 level.
Forecast for the week ahead
Bearish scenario
While the price has formed a pin bar on the confluence level, it suggests we will see a move down with higher probability than a move up and a breaking confluence level made of daily trend line and resistance level.
The bearish scenario is backed up with strong bearish candles with long body which means bears are currently stronger traders on the market.
First support that must be broken is 1.08275 level. When the price breaks down and candle close on H4 we can be looking the next support to be hit and that is 1.07825.
After the price break 1.08275 level we could see small pullback to that level before heading down to daily support line at 1.07825.
Bullish scenario
If the pin bar and confluence level do not stop the price in order to see price heading further up, we need to see price move above 1.09028 level and H4 candle close above that level. From there we could see price heading up to the 1.09913.
The market is not easily predictable and we need to prepare ourselves for both scenarios. Risk management is crucial in trading so play safe and set a stop loss.
(Click on image to enlarge)
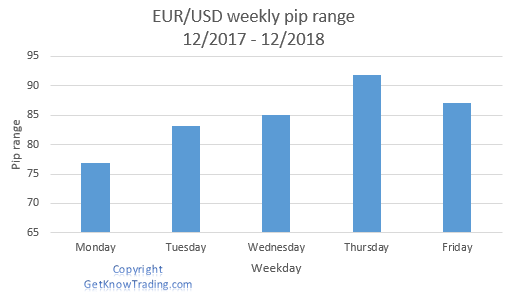
When to expect that the price hit one of the targets?
Based on the EUR/USD pip range analysis which tells us that Monday on average have around 70 pips pip range, Tuesday and Wednesday have over 80 pips we could see the price move to bearish or bullish position in 2-3 days.
Disclaimer: Any Advice or information is General Advice Only – It does not take into account your personal circumstances, please do not trade or invest based solely on this information. By ...
more


Wish I understood some of this charting. How about a beginner's crash course on how to read them?
Hi Alexis Renault,
I have tried to simplify charts as much is possible with comments.
A beginner's crash course is not available yet but I will plan to make one. Stay tuned and follow www.getknowtrading.com where I will make some course to help everyone who wants to read and understood charts.
Thanks you. I'm an avid reader of this site, but many of the articles have similar charts. I feel that I'm completely missing out on an entire aspect of investing by not knowing how to read them.
The charts have similar look because the analysis is done with same tools.
View on the market and making analysis is different from trader to trader.
There are basic rules and tools to make basic ground for further analysis so that is something you see all the time.
With proper guide you can learn those basics.
Learning how to read the market and making prediction about market direction requires experience aligned with knowledge. And that takes time and skills.
Do not think that it is impossible to learn that - no, it is possible.