

Previous day's summary
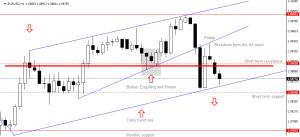
Yesterday we had break down of the daily trend line which happened during London and New York trading session overlap. At that time we had higher volatility that managed to bring the price down to the short term support at 1.08508.
Before breaking down daily trend line we had confluence between 1.08508 and 1.09028 which tells us that the daily trend line had some buyers fighting and not allowing to go down.
But the sellers managed to close the H4 candle below trend line on the next support line at 1.08275.
Today's overlook
Price pulled back from the price 1.08275 and we should wait and see what the price will tell us.
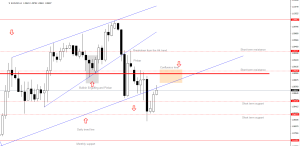
While price have a pull back and trend on H4 have changed direction from bullish into bearish, we could see price making retest of the bullish trend line and short term resistance at 1.09028.
Are between trend line and resistance level is the confluence level where we need to see what happens.
Bearish scenario
If the price reach that confluence level and make bearish price action pattern we could expect to reach 1.08275 and test it again. If the price close on H4 below 1.08275 we could see price reaching 1.07825 level which is monthly support line.
Bullish scenario
If the price reach confluence level and break out through 1.09028 level we could see small pullback to retest that level to confirm it as a new support level.
If we see bullish price action pattern we can expect that the price try to attack again the 1.09913 level.


Comments
Log in or sign up to join the conversation.