
Euro/British Pound Forex - Elliott Wave Technical Analysis

Image Source: Unsplash
Euro/British Pound (EURGBP) Day Chart
EURGBP Elliott Wave Technical Analysis
FUNCTION: Counter Trend
MODE: Corrective
STRUCTURE: Orange wave 2
POSITION: Navy blue wave 3
DIRECTION NEXT HIGHER DEGREES: Orange wave 3
Details:
Orange wave 1 appears completed, and orange wave 2 is now unfolding.
The EURGBP daily chart analysis shows a counter-trend correction developing inside a larger bearish trend. After completing orange wave 1's decline, the currency pair is currently engaged in orange wave 2 correction within the broader navy blue wave 3 downtrend. This suggests a temporary upward retracement before a possible continuation of the dominant bearish trend.
Orange wave 2, acting as the corrective phase, typically retraces 38% to 61% of the prior wave 1 decline, often forming familiar corrective structures like zigzags or flats. The completion of the initial downward impulse from wave 1 has set the stage for this pullback, generally characterized by overlapping price action and reduced momentum. On the daily timeframe, this correction is interpreted as an intermediate-term pause in the overall bearish cycle.
Following the completion of wave 2, a new decline into orange wave 3 is expected. This next impulse wave is anticipated to be the most powerful and extended portion of the sequence, potentially pushing well beyond wave 1's low. Traders should monitor wave 2’s development for typical signs of completion, including bearish reversal candlestick patterns and overbought momentum indicators.
This corrective phase offers traders an opportunity to prepare positions ahead of the anticipated continuation downward. Watching price action around important Fibonacci retracement levels will be crucial for optimizing trade entries as the transition from wave 2 to wave 3 occurs. The daily chart provides a critical viewpoint for understanding the potential impact of this correction within the broader bearish structure.
Utilizing technical indicators and observing price action are essential to confirming when the upward momentum weakens and the bearish trend resumes. This analysis emphasizes staying alert for signals of correction completion, suggesting the pair may soon move significantly lower after finalizing the current corrective phase.
(Click on image to enlarge)

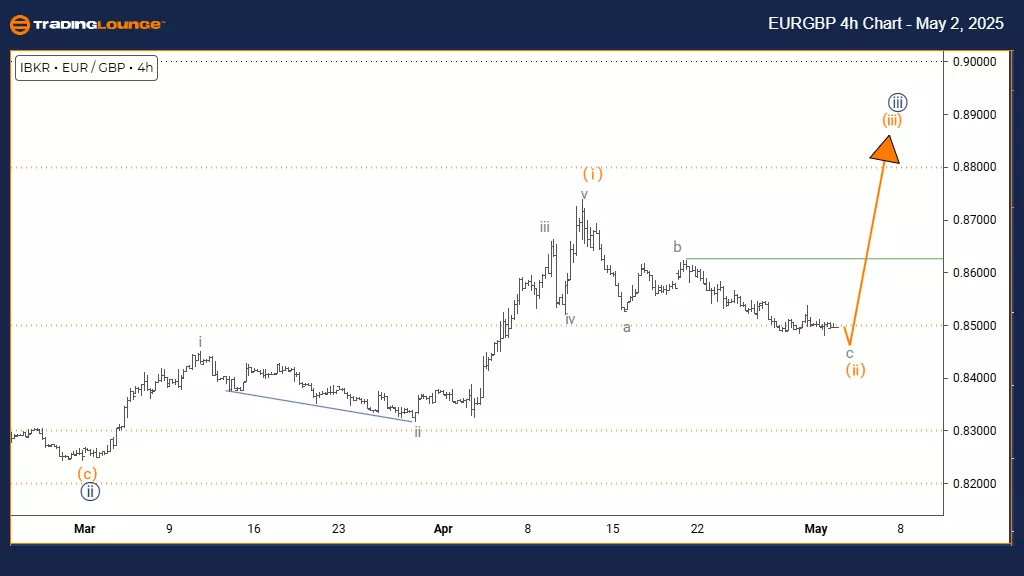
Euro/British Pound (EURGBP) 4-Hour Chart
EURGBP Elliott Wave Technical Analysis
FUNCTION: Counter Trend
MODE: Corrective
STRUCTURE: Orange wave 2
POSITION: Navy blue wave 3
DIRECTION NEXT HIGHER DEGREES: Orange wave 3
Details:
Orange wave 1 appears complete, and now orange wave 2 is developing.
The EURGBP 4-hour chart analysis shows a counter-trend correction unfolding within a broader bearish framework. After completing the decline of orange wave 1, the currency pair has transitioned into the corrective phase of orange wave 2, nested inside the larger navy blue wave 3 downtrend. This setup suggests a short-term upward retracement before the broader bearish trend resumes.
Orange wave 2 is expected to retrace around 38% to 61% of the orange wave 1 decline. The prior downward impulse has created the conditions for this corrective move, usually featuring overlapping price action and weaker momentum typical of corrective phases. The 4-hour timeframe highlights that this move might only represent a temporary pause within a more extensive bearish cycle.
The next expected shift is a decline into orange wave 3 once the orange wave 2 correction ends. This forthcoming impulse wave is predicted to be a strong downward move, likely surpassing the low of wave 1 significantly. Traders should watch for typical termination signals in wave 2, such as bearish reversal patterns and overbought momentum indicators.
This corrective move provides traders with potential setups to position for the upcoming wave 3 decline. Utilizing technical analysis tools can help confirm when the correction ends and the next downward impulse initiates. The structure signals that the EURGBP may soon resume its bearish trend after completing this corrective leg.
Close attention to price action around major Fibonacci retracement levels will be crucial for timing trade entries as the transition from wave 2 to wave 3 occurs. The 4-hour chart offers valuable insights into this ongoing corrective phase within the dominant bearish trend.
(Click on image to enlarge)
More By This Author:
Energy Select Sector ETF XLE - Elliott Wave Technical Analysis
Trading Strategies For S&P 500, Nasdaq 100, DAX 40, FTSE 100 & ASX 200
Qualcomm Inc. - Elliott Wave Technical Analysis
At TradingLounge™, we provide actionable Elliott Wave analysis across over 200 markets. Access live chat rooms, advanced AI & algorithmic charting tools, and curated trade ...
more

