
USDCAD Elliott Wave Analysis – Trading Lounge
U.S. Dollar / Canadian Dollar (USDCAD) Day Chart
USDCAD Elliott Wave Technical Analysis
FUNCTION: Bearish Trend
MODE: Impulsive
STRUCTURE: Navy blue wave 1
POSITION: Gray wave 1
DIRECTION NEXT HIGHER DEGREES: Navy blue wave 2
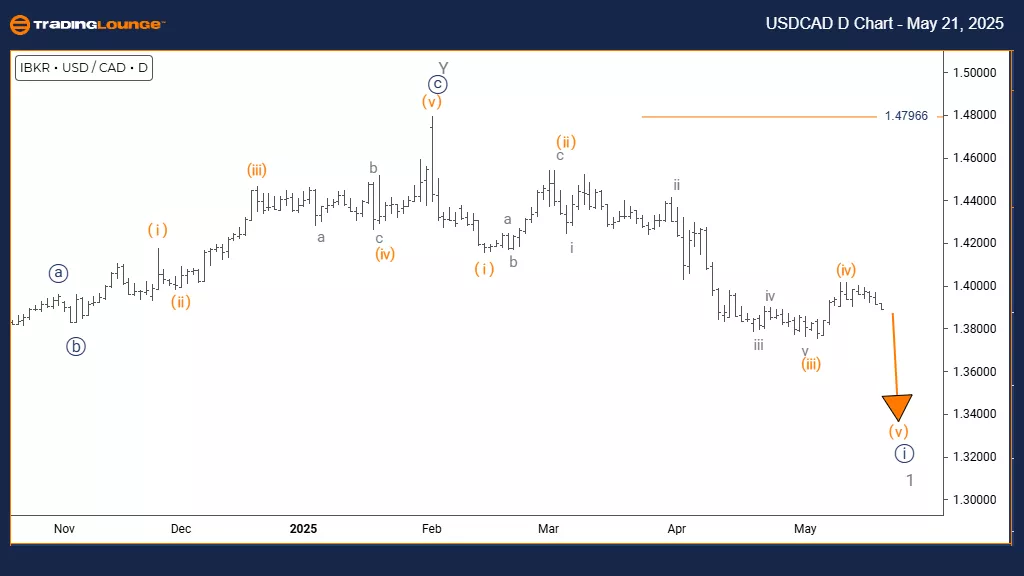
DETAILS: Navy blue wave 1 of gray wave 1 is underway. Wave invalidation level: 1.47966
The daily chart outlook for USDCAD signals a bearish scenario, with a clear downward trend appearing in the wave structure. The technical formation identifies navy blue wave 1 forming within a broader bearish trend defined as gray wave 1. This setup implies the pair is likely in the early stages of a deeper downtrend.
Currently, navy blue wave 1 of gray wave 1 is progressing, representing the initial impulse of a larger downward cycle. The pattern reflects consistent selling pressure, and the daily timeframe suggests the bearish trend could continue to unfold. An invalidation level is marked at 1.47966—crossing above this would nullify the current wave count and indicate a need for reanalysis.
This wave structure provides insight into USDCAD’s position in what might become a new bearish cycle. The pattern indicates significant downside potential, with navy blue wave 1 only the beginning. The next expected phase is navy blue wave 2, which will be corrective and will follow the completion of the current decline.
Traders should watch for signs confirming the impulse wave’s continuation while staying alert to any break above the invalidation level. This breach would challenge the current outlook. The overall daily analysis supports the case for sustained bearish movement in the market.
U.S. Dollar / Canadian Dollar (USDCAD) 4 Hour Chart
USDCAD Elliott Wave Technical Analysis
FUNCTION: Bearish Trend
MODE: Impulsive
STRUCTURE: Orange wave 5
POSITION: Navy blue wave 1
DIRECTION NEXT LOWER DEGREES: Orange wave 5 (in progress)
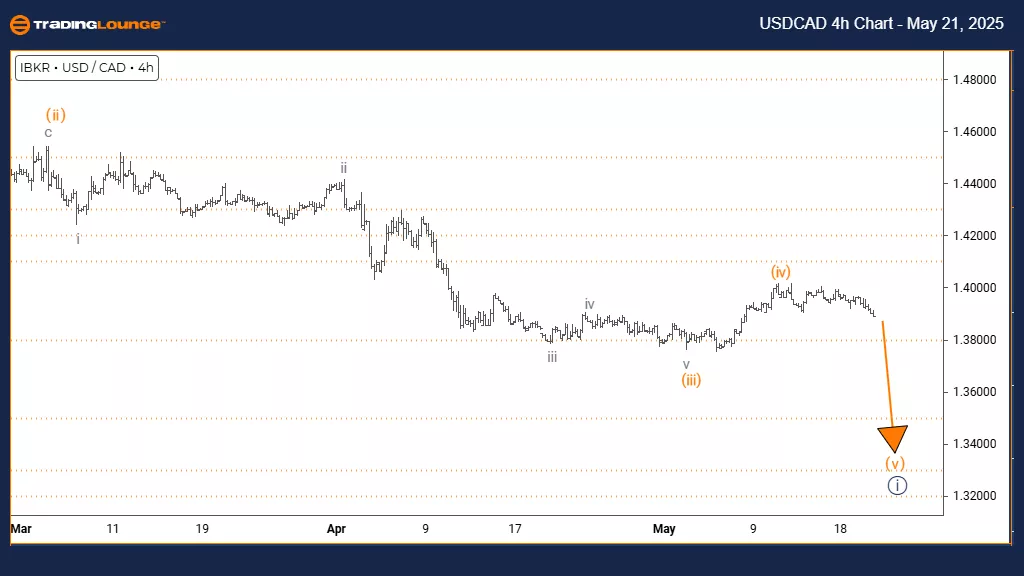
DETAILS: Orange wave 4 appears complete; orange wave 5 is active.
The 4-hour chart indicates a clear bearish trend in USDCAD, with strong downward movement. The current Elliott Wave structure shows orange wave 5 unfolding within navy blue wave 1. This setup follows the completion of orange wave 4, signaling the start of the final downward phase in this impulsive move.
Confirmation that orange wave 4 has ended supports the active status of orange wave 5. This wave suggests continued bearish momentum, with selling pressure dominating the trend. Positioned within navy blue wave 1, this phase may extend further, potentially indicating more downside ahead or a nearing point of market fatigue.
This configuration offers traders guidance for evaluating short positions, with risk control as a priority. Orange wave 5 is expected to drive the final downward leg of the current cycle. Traders should observe price behavior for common fifth-wave signs such as momentum divergence or a deceleration in price drops.
The structure identifies both the remaining bearish potential and crucial points for trend validation or reversal signals. While the bearish view remains intact based on the wave count, awareness of pattern completion signals is essential. This Elliott Wave analysis offers practical tools for managing positions in what might be the concluding stage of this downtrend.
Technical Analyst: Malik Awais
More By This Author:
Elliott Wave Technical Analysis: Bitcoin Crypto Price News For Wednesday, May 21
Elliott Wave Technical Forecast: Cochlear Limited - Tuesday, May 20
Elliott Wave Technical Analysis: Texas Instruments Inc. - Tuesday, May 20


Comments
Log in or sign up to join the conversation.