
USDCAD Elliott Wave Analysis – Trading Lounge
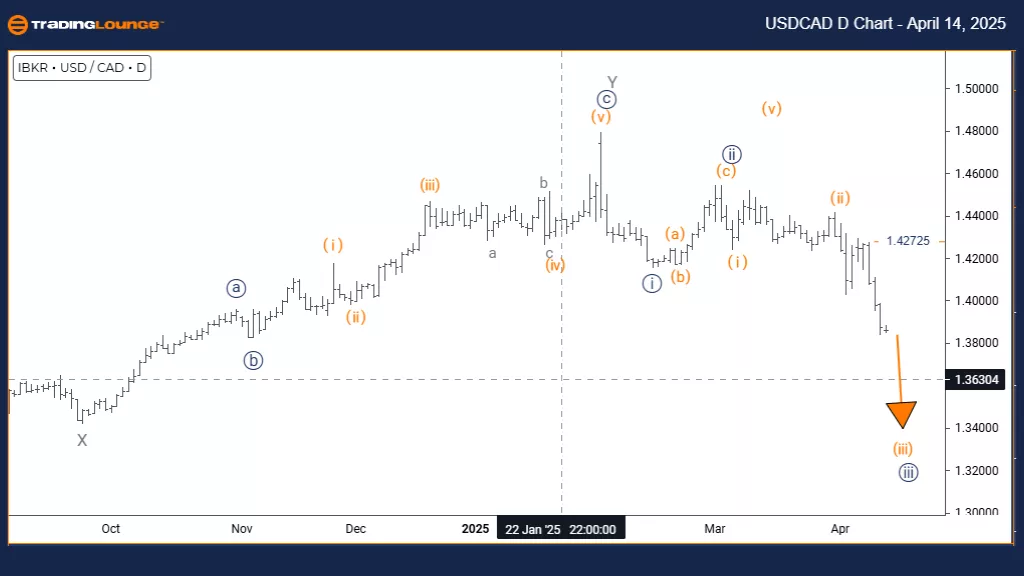
U.S. Dollar / Canadian Dollar (USDCAD) – Day Chart
USDCAD Elliott Wave Technical Analysis
FUNCTION: Bearish Trend
MODE: Impulsive
STRUCTURE: Orange Wave 3
POSITION: Navy Blue Wave 3
DIRECTION NEXT HIGHER DEGREES: Orange Wave 4
DETAILS: Orange wave 2 appears completed; currently in orange wave 3.
Wave Cancel Invalid Level: 1.42725
The USDCAD daily chart shows a developing bearish trend within an impulsive Elliott Wave framework. The pair appears to have completed the orange wave 2 correction and has entered orange wave 3, which falls under the broader navy blue wave 3 formation. This suggests the pair is moving into a strong downward impulse, aligning with a longer-term bearish outlook.
Typically, orange wave 3 is the most forceful part of an Elliott sequence, marked by sustained price moves and strong momentum. With wave 2 now likely finished, wave 3 is expected to show a deeper decline, often surpassing the reach of wave 1. Based on the current setup, this downward momentum is expected to persist until a corrective phase begins.
Next, traders should expect orange wave 4 to develop once wave 3 concludes. This next wave is likely to be corrective, possibly offering a short-term recovery or pullback before the bearish trend resumes. Watch closely for signs of wave 3 nearing its typical Fibonacci extension target, signaling potential transition.
A key resistance level to watch is 1.42725. A move above this would invalidate the current bearish wave count and call for a revised wave structure. This level guards the high of wave 2 and serves as a crucial reference for trade risk management.
The daily chart offers clarity on the mid-term wave development. With the market positioned in an impulsive wave, there's potential for more downside movement. Traders should monitor for the characteristics of wave 3: sustained momentum and consistent price movement. Maintain a bearish view while this phase unfolds, and rely on volume and momentum indicators to detect transitions into corrective phases.
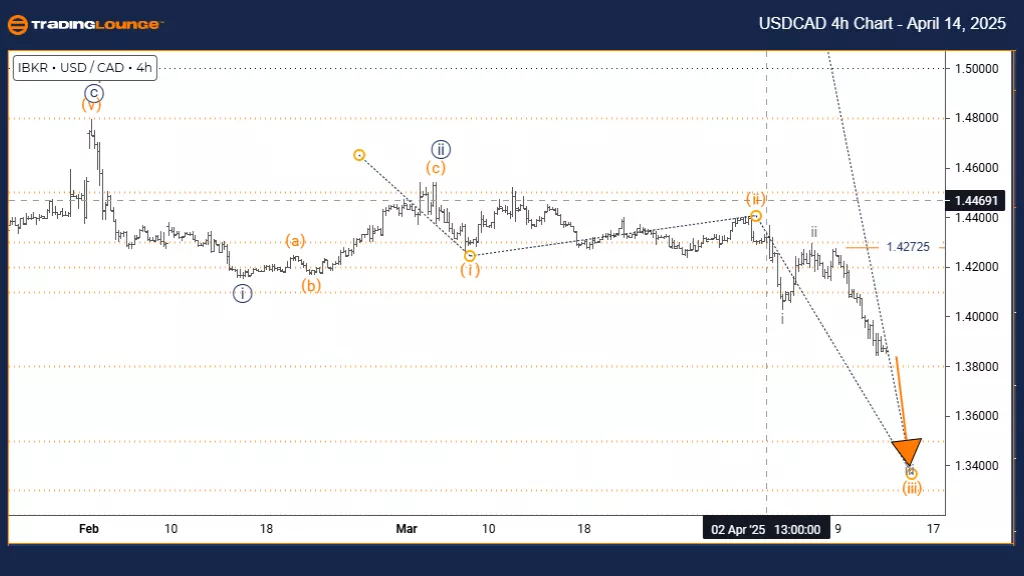
U.S. Dollar / Canadian Dollar (USDCAD) – 4 Hour Chart
USDCAD Elliott Wave Technical Analysis
FUNCTION: Bearish Trend
MODE: Impulsive
STRUCTURE: Gray Wave 3
POSITION: Orange Wave 3
DIRECTION NEXT HIGHER DEGREES: Gray Wave 4
DETAILS: Gray wave 2 appears completed; currently in gray wave 3.
Wave Cancel Invalid Level: 1.42725
On the 4-hour chart, USDCAD is displaying a bearish trend within an impulsive Elliott Wave structure. The market has completed gray wave 2 and transitioned into gray wave 3, which unfolds within a larger orange wave 3 pattern. This alignment signals a strong downward impulse as part of a larger bearish framework.
Gray wave 3 is commonly the strongest wave in Elliott Wave theory, often showing extensive price movement with high momentum. With the wave 2 correction likely completed, this third wave is expected to continue its descent with significant strength. The structure supports the potential for further declines before reaching the next corrective phase.
The expected next move is gray wave 4, once gray wave 3 has finished. This wave is anticipated to be corrective, possibly presenting a short-lived recovery or pullback. Traders should watch closely for signs of gray wave 3 nearing typical Fibonacci extension targets, signaling a shift in the current trend.
The critical resistance level remains at 1.42725. If this level is breached to the upside, it would invalidate the existing wave count, requiring a fresh pattern evaluation. This threshold serves as protection for the wave 2 high and helps define risk levels.
Wave 3’s impulsive nature highlights strong market engagement in the bearish direction. Given this, traders should continue to look for wave 3 traits—persistent momentum and consistent downside progress. Until clear signs of wave 3 completion surface, bearish setups remain favored. Keep an eye on momentum and volume indicators to confirm wave transitions.
Technical Analyst: Malik Awais
More By This Author:
Elliott Wave Trading Strategies: SP500, Nasdaq & April Tech Earnings Insights
Elliott Wave Technical Forecast: Suncorp Group Limited
Elliott Wave Technical Analysis: Berkshire Hathaway Inc. - Friday, April 11


Comments
Log in or sign up to join the conversation.