
NZDUSD Elliott Wave Analysis – TradingLounge
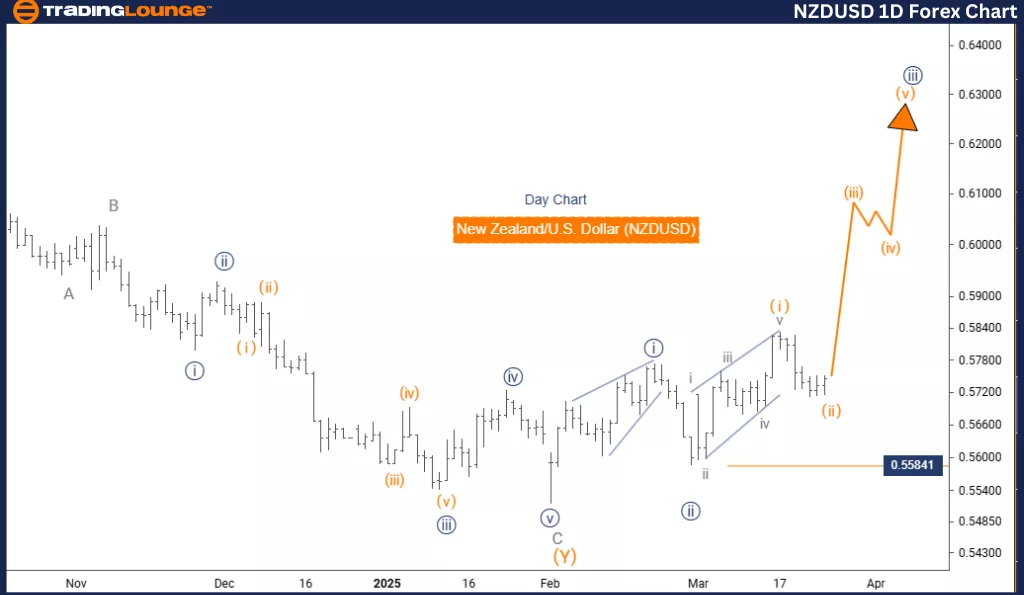
New Zealand Dollar / U.S. Dollar (NZDUSD) – Day Chart
NZDUSD Elliott Wave Technical Analysis
Function: Bullish Trend
Mode: Impulsive
Structure: Navy Blue Wave 3
Position: Gray Wave 1
Direction Next Higher Degrees: Navy Blue Wave 3 (continuing)
Wave Cancel Invalid Level: 1.55841
The Elliott Wave analysis for the NZDUSD daily chart presents a strong bullish outlook. The pair is currently advancing through navy blue wave 3, with gray wave 1 unfolding within it. Analysts confirm the completion of navy blue wave 2, signaling that wave 3 is actively progressing upward.
This third wave is a pivotal phase, known for delivering strong momentum and extended price movement. The invalidation level is set at 1.55841—any break below this would challenge the current bullish count and may indicate a potential reversal.
From the daily chart’s perspective, traders can capture substantial trend moves while maintaining insight into the broader wave formation. The unfolding navy blue wave 3 presents a compelling entry opportunity within the larger bullish gray wave 1 structure.
Classic signs of impulsive waves—such as long price surges, rising momentum, and volume spikes—are expected to accompany this move. Maintaining long positions remains consistent with the dominant trend, but applying risk controls near the invalidation level is crucial.
This Elliott Wave framework helps traders interpret both short-term opportunities and long-term market structure. By aligning entries and position management within this bullish context, traders enhance their ability to act decisively and confidently.
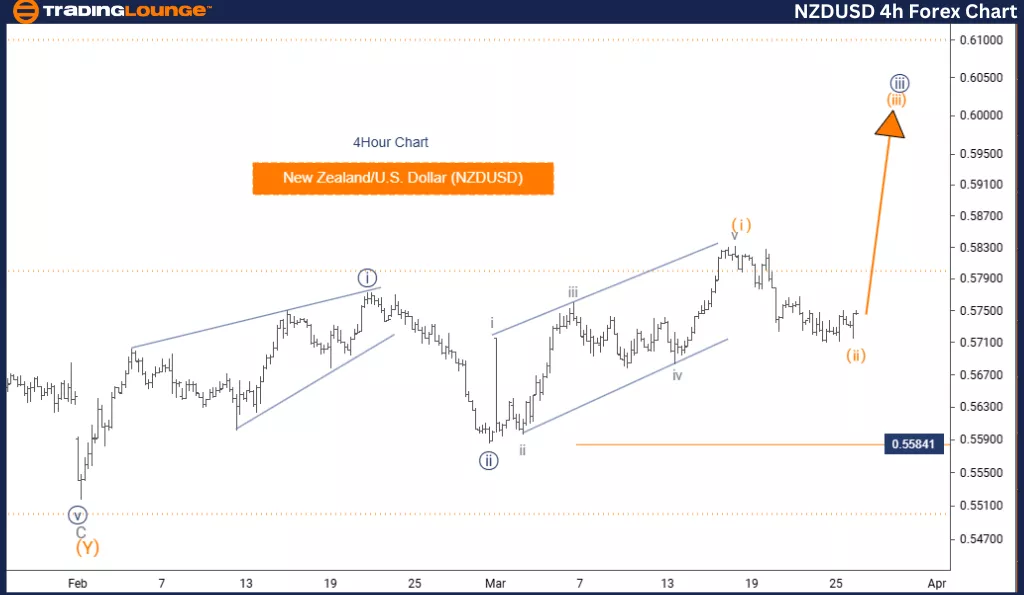
New Zealand Dollar / U.S. Dollar (NZDUSD) – 4-Hour Chart
NZDUSD Elliott Wave Technical Analysis
Function: Bullish Trend
Mode: Impulsive
Structure: Orange Wave 3
Position: Navy Blue Wave 3
Direction Next Higher Degrees: Orange Wave 3 (started)
Wave Cancel Invalid Level: 1.55841
The 4-hour Elliott Wave analysis for NZDUSD maintains a bullish stance, highlighting strong momentum within a well-established impulsive wave trend. The key focus is on orange wave 3, which unfolds as part of the larger navy blue wave 3 in the overall wave count. Analysts confirm the completion of orange wave 2, with the pair now advancing within a robust orange wave 3 phase.
This wave is often the strongest and most extended in the Elliott Wave sequence, pointing to significant upside potential for the NZDUSD pair. The invalidation level is defined at 1.55841—a breach here would challenge the current bullish outlook.
The 4-hour chart gives traders precise timing to capitalize on short-term trends, while still aligning with the broader bullish wave formation. The active orange wave 3 offers both a near-term opportunity and a strategic component of the longer-term navy blue wave 3.
Traders should look for impulsive wave confirmations such as strong upward momentum, rising volume, and extended price movements. Long positions remain favorable under current conditions, but strict risk management near the invalidation point is advised.
This framework is designed to help traders align their strategies with the prevailing trend in NZDUSD. By observing the wave degree structure and recognizing key levels, market participants can better time entries and manage risk.
Technical Analyst: Malik Awais
More By This Author:
Elliott Wave Technical Analysis: Gold - Tuesday, March 25
U.S. Stocks Technical Analysis - Apple Inc.
Elliott Wave Technical Analysis: U.S. Dollar/Swiss Franc - Tuesday, March 25


Comments
Log in or sign up to join the conversation.