
Elliott Wave Technical Analysis: U.S. Dollar/Swiss Franc - Tuesday, March 25
USDCHF Elliott Wave Analysis – Trading Lounge
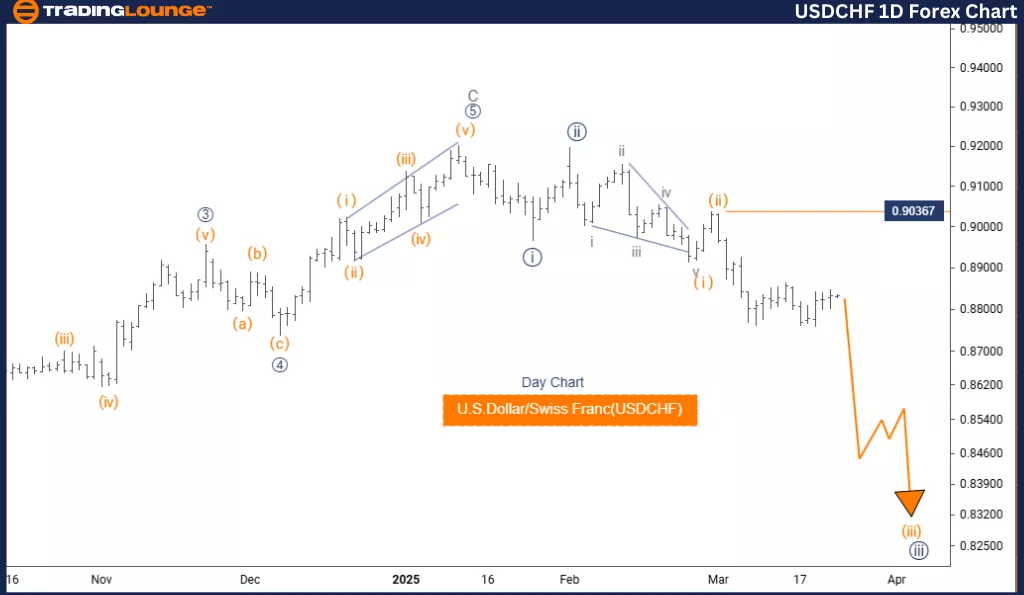
U.S. Dollar / Swiss Franc (USDCHF) – Day Chart
USDCHF Elliott Wave Technical Analysis
Function: Bearish Trend
Mode: Impulsive
Structure: Orange Wave 3
Position: Navy Blue Wave 3
Next Higher Degree Direction: Continuation of Orange Wave 3
Wave Cancel Invalid Level: 0.90367
The Elliott Wave analysis for USDCHF on the daily chart outlines a technical view of the current market condition and likely direction. The analysis identifies a bearish market trend, represented by an impulsive pattern rather than a corrective one. The primary focus is on orange wave 3, which belongs to a broader sequence and currently sits within navy blue wave 3 in the higher degree structure.
It appears that orange wave 2 has concluded, and the market is now transitioning into orange wave 3 of 3. This wave is expected to drive further downside movement, continuing the bearish trend. Strong downward price action is likely before any potential reversal is considered.
The critical invalidation level for this wave count is 0.90367. A move above this level would invalidate the current wave analysis and might signal a shift in trend direction. Traders are encouraged to monitor orange wave 3 closely, as it may extend further within this bearish sequence.
This analysis highlights the significance of wave pattern identification for forecasting market behavior. The daily chart view provides a medium-term outlook and supports strategy development in line with the prevailing downward trend. Understanding wave relationships and degrees offers valuable insights for navigating strong directional markets.
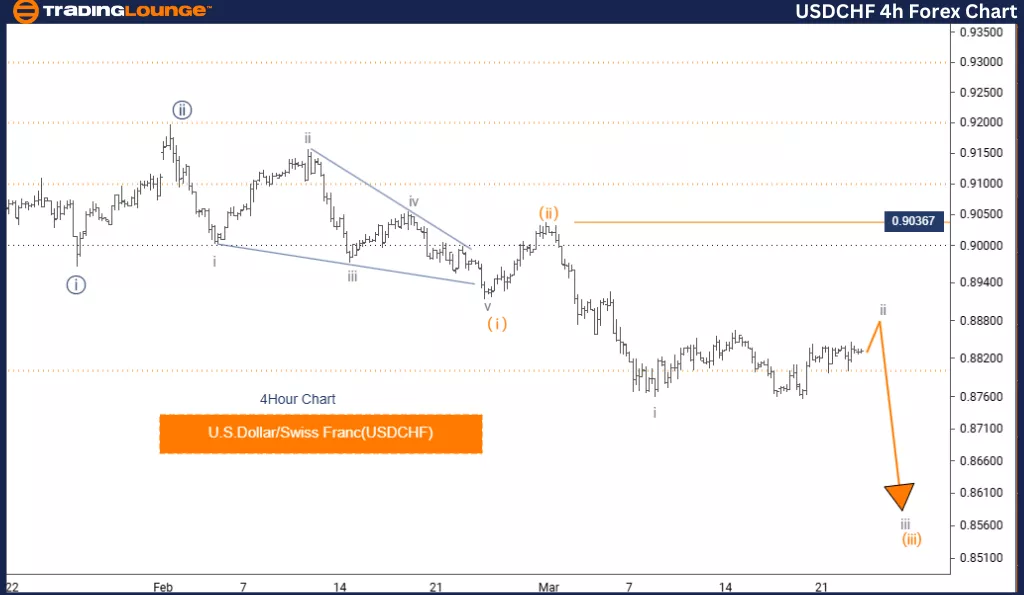
U.S. Dollar / Swiss Franc (USDCHF) – 4 Hour Chart
USDCHF Elliott Wave Technical Analysis
Function: Counter Trend
Mode: Corrective
Structure: Gray Wave 2
Position: Orange Wave 3
Next Lower Degree Direction: Gray Wave 3
Wave Cancel Invalid Level: 0.90367
The 4-hour Elliott Wave analysis for USDCHF offers a short-term technical view of the U.S. Dollar/Swiss Franc currency pair. It classifies the market phase as a counter-trend, reflecting corrective price action rather than a strong directional move. The analysis focuses on gray wave 2, situated within a broader structure marked by orange wave 3.
Evidence suggests that gray wave 1 has ended, with the market now engaged in gray wave 2. This wave is corrective in nature, implying it may result in sideways movement or a retracement before a new trend emerges. The next significant movement to anticipate is gray wave 3, which is expected to begin once gray wave 2 is complete.
The level of 0.90367 is the invalidation point. Should price move above this threshold, the current wave interpretation would be invalidated, indicating a possible shift in market conditions. Traders should track the progression of gray wave 2 carefully and stay alert for signs of gray wave 3's emergence.
This focused 4-hour chart review provides traders with a useful structure for understanding near-term price action. It aids in aligning short-term strategies with expected market shifts during this corrective phase. Recognizing wave completions and upcoming transitions helps traders make informed decisions and adapt to changing market dynamics efficiently.
Technical Analyst: Malik Awais
More By This Author:
Unlocking ASX Trading Success: Insurance Australia Group Limited - Monday, March 24
Elliott Wave Technical Analysis - Microsoft Inc.
Elliott Wave Technical Analysis: Australian Dollar/U.S. Dollar - Monday, March 24
At TradingLounge™, we provide actionable Elliott Wave analysis across over 200 markets. Access live chat rooms, advanced AI & algorithmic charting tools, and curated trade ...
more

