
NZDUSD Elliott Wave Analysis Trading Lounge
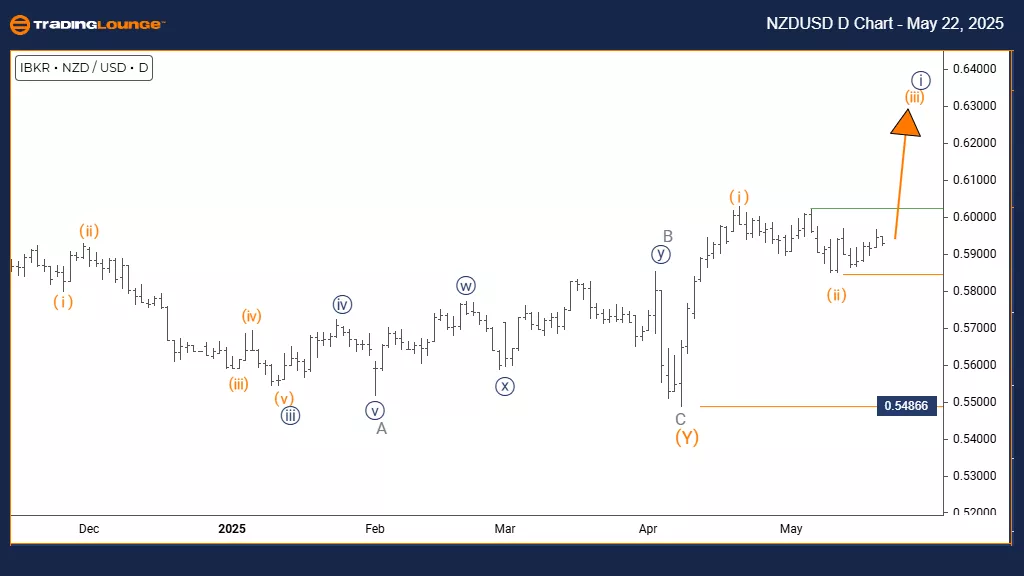
New Zealand Dollar/ U.S. Dollar (NZDUSD) Day Chart
NZDUSD Elliott Wave Technical Analysis
FUNCTION: Bullish Trend
MODE: Impulsive
STRUCTURE: Orange Wave 3
POSITION: Navy Blue Wave 1
DIRECTION NEXT LOWER DEGREES: Orange Wave 4
DETAILS: Completion of orange wave 2 appears confirmed; orange wave 3 is now underway. Wave cancel/invalid level: 0.54866
The daily chart indicates a bullish trend for NZDUSD, supported by the momentum in the current wave formation. The chart shows the progression of orange wave 3 within a broader bullish pattern defined as navy blue wave 1. This structure implies that the corrective phase of orange wave 2 has ended, and the pair is now in a typically strong segment of an Elliott Wave impulse pattern. This setup suggests possible continued gains for the pair in this upward move.
Analysis supports the view that orange wave 2 has ended, initiating orange wave 3’s rise. Its impulsive features highlight ongoing buying interest. On the daily chart, this phase may sustain for a notable period. Once this third wave completes, the next development is expected to be orange wave 4, marking a corrective movement that follows the current uptrend.
This wave analysis helps traders understand the pair's place in the larger bullish trend. The structure points to stronger upward price action during this wave 3 before the onset of the next correction. Traders should track market activity for signs of further progress in wave 3 and also remain aware of characteristics that typically emerge near the end of impulsive waves, such as growing volume and rising momentum.
The overview provides practical insights for managing positions during this active bullish phase. With wave count analysis showing continued upward potential, traders are advised to stay vigilant for any early signs of trend fatigue that may precede wave 4. The daily outlook underscores a robust bullish formation with potential longevity in forex markets.
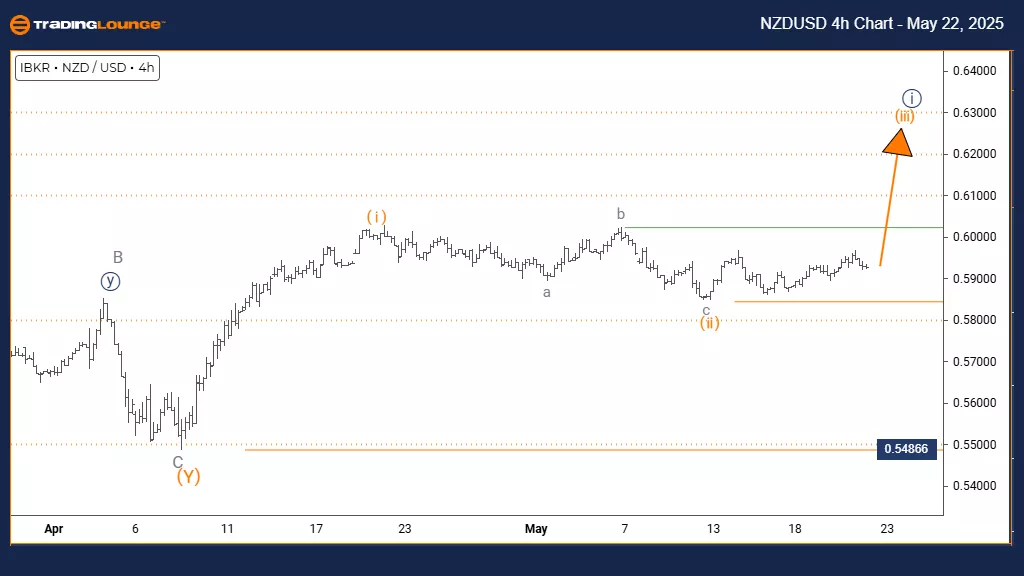
New Zealand Dollar/ U.S. Dollar (NZDUSD) 4 Hour Chart
NZDUSD Elliott Wave Technical Analysis
FUNCTION: Bullish Trend
MODE: Impulsive
STRUCTURE: Orange Wave 3
POSITION: Navy Blue Wave 1
DIRECTION NEXT HIGHER DEGREES: Orange Wave 3 (Started)
DETAILS: Orange wave 2 appears complete; orange wave 3 is currently active. Wave Cancel/Invalid Level: 0.54866
The 4-hour chart reflects strong bullish momentum in NZDUSD within a continuing uptrend. The setup identifies orange wave 3 as forming part of a broader upward pattern marked as navy blue wave 1. This indicates that the market has moved past the corrective orange wave 2 and is now in a high-momentum stage typical of a strong Elliott Wave impulse. This signals potential for extended movement in favor of the bulls during this active market phase.
The wave structure confirms orange wave 2's end, with orange wave 3 now gaining traction. The impulse characteristics indicate persistent buying strength, and current technical conditions suggest more room for the rally to grow. A critical invalidation level remains set at 0.54866; a move below this would challenge the current bullish scenario and could imply a more complex correction or trend reversal.
This chart framework gives traders essential insight into NZDUSD's broader position within its upward cycle. The ongoing wave 3 advance could lead to more significant gains before a corrective wave develops. Traders should keep an eye on price signals that support continuation, while recognizing the likelihood of an eventual shift to wave 4's correction.
The analysis provides useful input for trade management during this potentially lucrative period. While the structure shows more upside, traders should enforce solid risk controls due to the extended nature of this advance. The invalidation level remains a key reference point for maintaining the bullish outlook, and the ongoing wave 3 stage indicates potential for continued strength in the pair.
Technical Analyst: Malik Awais
More By This Author:
Elliott Wave Technical Analysis: Theta Token Crypto Price News For Thursday, May 22
Elliott Wave Technical Analysis & Trading Strategies: S&P 500, Nasdaq 100, DAX 40, FTSE 100, ASX 200
Elliott Wave Technical Forecast: Newmont Corporation - Wednesday, May 21


Comments
Log in or sign up to join the conversation.