
Euro/U.S. Dollar (EURUSD) – Daily Chart
Technical Analysis Overview
FUNCTION: Bullish Trend
MODE: Impulsive
STRUCTURE: Orange Wave 5
POSITION: Navy Blue Wave 1
DIRECTION NEXT LOWER DEGREES: Navy Blue Wave 2
DETAILS: Orange Wave 4 appears completed; Orange Wave 5 now in play
Wave Cancel Invalid Level: 1.1433
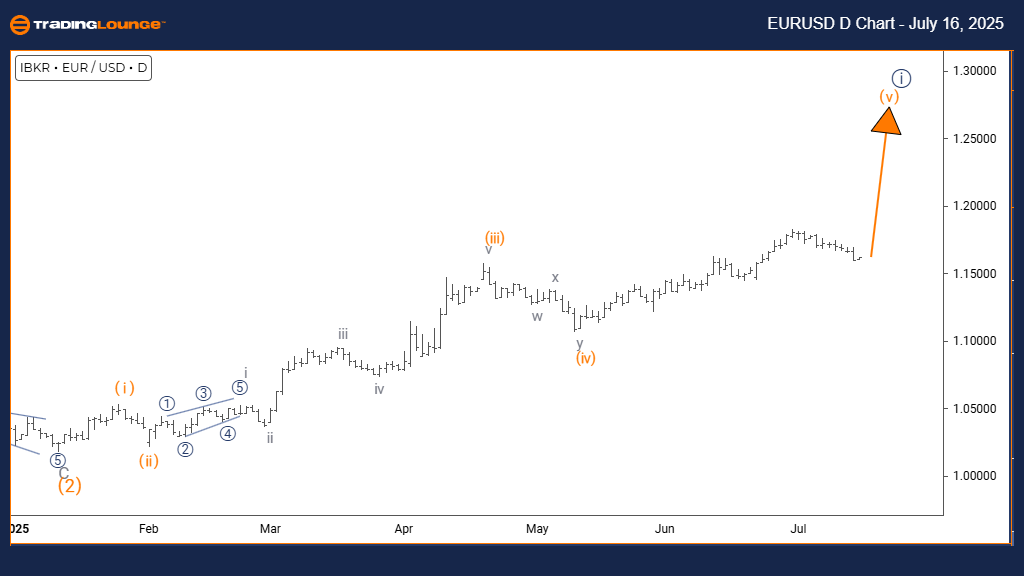
The EURUSD daily chart shows a bullish market structure with an impulsive wave in progress. Orange Wave 5 is developing within a larger Navy Blue Wave 1, pointing to an advanced phase of the bullish cycle. The prior Orange Wave 4 correction is considered complete, and the market is now moving within Orange Wave 5, typically the final wave in an impulsive sequence.
This current upward wave shows strong bullish momentum with higher highs, aligning with a healthy trend. Since it falls under Navy Blue Wave 1, this move is likely part of a broader bullish scenario. After Orange Wave 5 concludes, a corrective Navy Blue Wave 2 is expected. The 1.1433 level serves as a key support line — a break below it would invalidate this wave structure.
This analysis implies that EURUSD is nearing the end of its current impulsive wave, suggesting limited upside before a corrective move begins. Traders should watch for signs of Wave 5 completion to anticipate the next pullback. The 1.1433 threshold remains crucial for managing risk and confirming the current bullish wave count.
Euro/U.S. Dollar (EURUSD) – 4-Hour Chart
Technical Analysis Overview
FUNCTION: Counter Trend
MODE: Corrective
STRUCTURE: Gray Wave 2
POSITION: Orange Wave 3
DIRECTION NEXT HIGHER DEGREES: Gray Wave 3
DETAILS: Gray Wave 1 appears completed; Gray Wave 2 in play
Wave Cancel Invalid Level: 1.1433
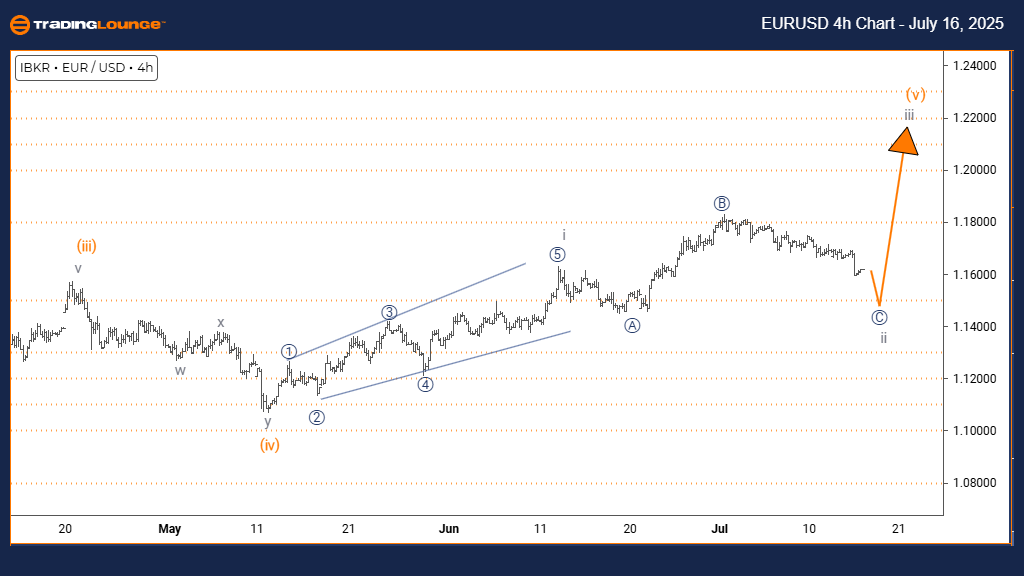
The 4-hour Elliott Wave analysis shows EURUSD in a corrective phase. Gray Wave 2 is currently unfolding within the broader Orange Wave 3 structure. The preceding Gray Wave 1 is now considered complete. Gray Wave 2 reflects a temporary retracement in the broader trend.
This corrective movement lacks strong direction and may be shallow or sideways. After this phase ends, Gray Wave 3 is expected to begin, resuming the broader bullish trend. As long as the price remains above 1.1433, the wave count remains valid. A drop below this level would invalidate the current analysis.
Traders should track the development of Gray Wave 2 for signs of exhaustion, which would signal the start of the next impulsive move. The analysis indicates this is a short-term counter-trend phase within a broader bullish setup. The 4-hour view helps spot transition points and manage risk effectively using the invalidation level.
Technical Analyst: Malik Awais
More By This Author:
Unlocking ASX Trading Success: Mineral Resources Limited - Wednesday, July 16
Elliott Wave Technical Analysis: Vechain Crypto Price News For Wednesday, July 16
S&P BSE SENSEX Next 50 Index Elliott Wave Technical Forecast


Comments
Log in or sign up to join the conversation.