
S&P BSE SENSEX NEXT 50 – Elliott Wave Analysis (Day Chart)
Trading Lounge Technical Overview
FUNCTION: Bullish Trend
MODE: Impulsive
STRUCTURE: Orange Wave 3
POSITION: Navy Blue Wave 3
DIRECTION NEXT HIGHER DEGREES: Orange Wave 3 (ongoing)
DETAILS: Orange Wave 2 completed; Orange Wave 3 now active
Wave Cancel Invalid Level: 70146
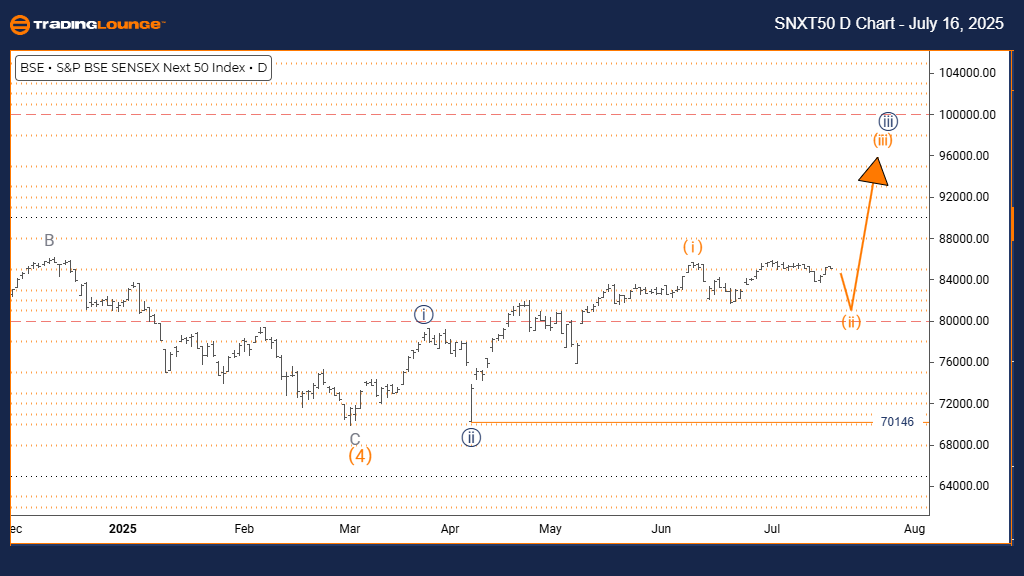
The daily chart for the S&P BSE SENSEX NEXT 50 reveals a bullish setup with a strong impulsive wave in progress. Orange Wave 3 is forming within Navy Blue Wave 3, marking what is typically the most dynamic phase in an Elliott Wave pattern. Technical observations confirm Orange Wave 2 has ended, and the index is now developing Orange Wave 3.
This wave phase shows solid momentum with rising highs, indicating strong demand. Positioned within Navy Blue Wave 3, this movement supports a significant ongoing bullish trend. The 70146 level serves as the key invalidation point — if breached, the wave count would need reassessment.
The analysis signals that the index has moved into a strong advancing phase, and Orange Wave 3 may offer substantial upside before any corrective pullback. Traders should track momentum and monitor the 70146 level to confirm trend validity and manage risk accordingly.
S&P BSE SENSEX NEXT 50 – Elliott Wave Analysis (Weekly Chart)
Trading Lounge Technical Overview
FUNCTION: Bullish Trend
MODE: Impulsive
STRUCTURE: Navy Blue Wave 3
POSITION: Gray Wave 1
DIRECTION NEXT LOWER DEGREES: Navy Blue Wave 4
DETAILS: Navy Blue Wave 2 completed; Navy Blue Wave 3 now developing
Wave Cancel Invalid Level: 70146
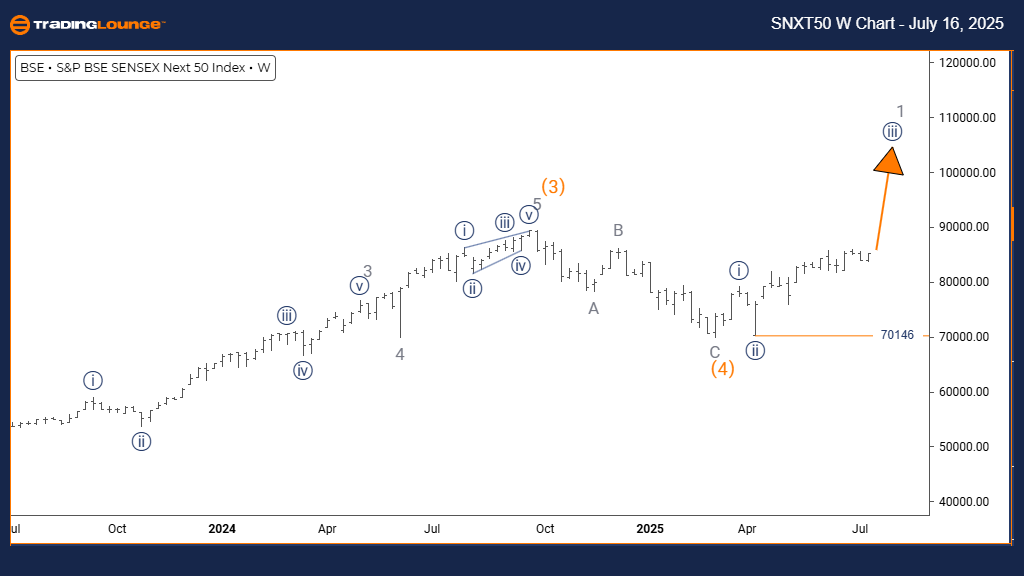
The weekly chart analysis of the S&P BSE SENSEX NEXT 50 confirms a strong bullish trend driven by impulsive wave activity. Navy Blue Wave 3 is progressing inside a broader Gray Wave 1, suggesting the early stages of a powerful upward cycle. Technical review shows that Navy Blue Wave 2 has completed, and the index has entered Navy Blue Wave 3.
The current wave structure signals continued upward strength, backed by higher highs and active volume, indicating institutional interest. As the wave develops, it reflects a potential long-term trend continuation. The 70146 invalidation level is critical to confirm this outlook.
This analysis supports that the index remains in a bullish phase, and traders can expect Navy Blue Wave 3 to provide profitable opportunities before entering a corrective Navy Blue Wave 4. The broader trend remains strong, and this structure helps traders align their positions with the prevailing momentum.
Technical Analyst: Malik Awais
More By This Author:
Unlocking ASX Trading Success: Mineral Resources Limited - Wednesday, July 16
Elliott Wave Technical Analysis: Vechain Crypto Price News For Wednesday, July 16
Unlocking ASX Trading Success: Unibail-Rodamco-Westfield - Tuesday, July 15


Comments
Log in or sign up to join the conversation.