

Image Source: Pixabay
USDJPY Elliott Wave Analysis Trading Lounge Day Chart, 15 August 2023.
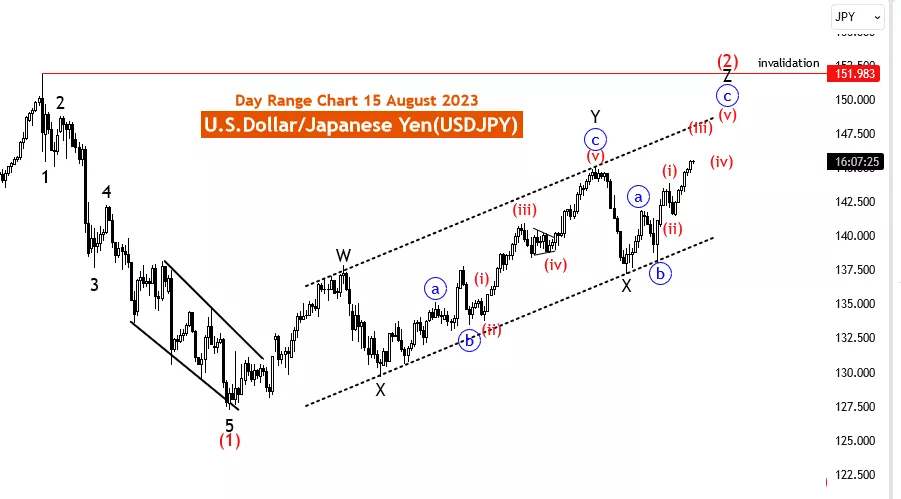
U.S. Dollar/Japanese Yen (USDJPY) Day Chart
USDJPY Elliott Wave Technical Analysis
Function: Counter Trend
Mode: impulsive
Structure: WXYXZ
Position: Red wave 2
Direction Next lower Degrees: Red Wave 3 (new trend after Z)
Details: Subwave Wave “3 of C of Z” in Play. Wave Cancel invalid level: 151.983
The Elliott Wave analysis of the U.S. Dollar to Japanese Yen currency pair (USDJPY) for 15 August 23, is conducted on the day chart, emphasizing the counter-trend nature of the market. This analysis focuses on the intricacies of the impulsive mode, the WXYXZ market structure, and the positioning of the Red wave 2.
The central objective of this analysis is to decode the counter-trend behavior of the USDJPY pair, wherein the prevailing price movements oppose the overarching market trend. The impulsive mode indicates that the market is undergoing rapid and substantial price fluctuations, thereby offering potential trading opportunities for traders to explore.
The market structure is defined as WXYXZ, encapsulating the sequence of waves and corrective phases that constitute the market's trajectory. This intricate pattern serves as a roadmap for understanding and anticipating the subsequent price actions.
A pivotal element of this analysis is the recognition of the Red wave 2's significance within the broader pattern. The positioning of Red wave 2 within the hierarchy of wave degrees is pivotal in comprehending the relationships between various waves.
Importantly, this analysis emphasizes the ongoing presence of Subwave Wave “3 of C of Z,” which is currently unfolding. This signifies the continuous nature of market movements and highlights the necessity of closely monitoring developments to glean valuable insights.
The analysis additionally provides a Wave Cancel invalid level at 151.983, which serves as a reference point. If the price surpasses this threshold, it implies that the current wave analysis might require reevaluation. This reinforces the importance of incorporating risk management strategies and being prepared for alternative scenarios.
To conclude, the day chart Elliott Wave analysis of USDJPY unveils the counter-trend impulsive movement and its implications for traders. This analysis serves as a guide for traders to refine their strategies, identify potential entry and exit points, and make informed decisions based on the prevailing market structure. However, traders should integrate fundamental analysis and market sentiment to ensure a comprehensive trading approach and effective risk management.
Additionally, staying vigilant about potential changes in the market is crucial for adapting strategies as the market evolves.
More By This Author:
S&P500 Trading Strategy - Elliott Wave Technical Analysis
Elliott Wave Technical Analysis: Vechain/U.S. Dollar - Monday, Aug. 14
Elliott Wave Technical Analysis Lam Research Corp - Monday, August 14


Comments
Log in or sign up to join the conversation.