CoT - Peek Into Future Through Futures; How Hedge Funds Are Positioned
Following futures positions of non-commercials are as of December 17, 2024.
10-year note: Currently net short 732.9k, down 142.8k.
(Click on image to enlarge)
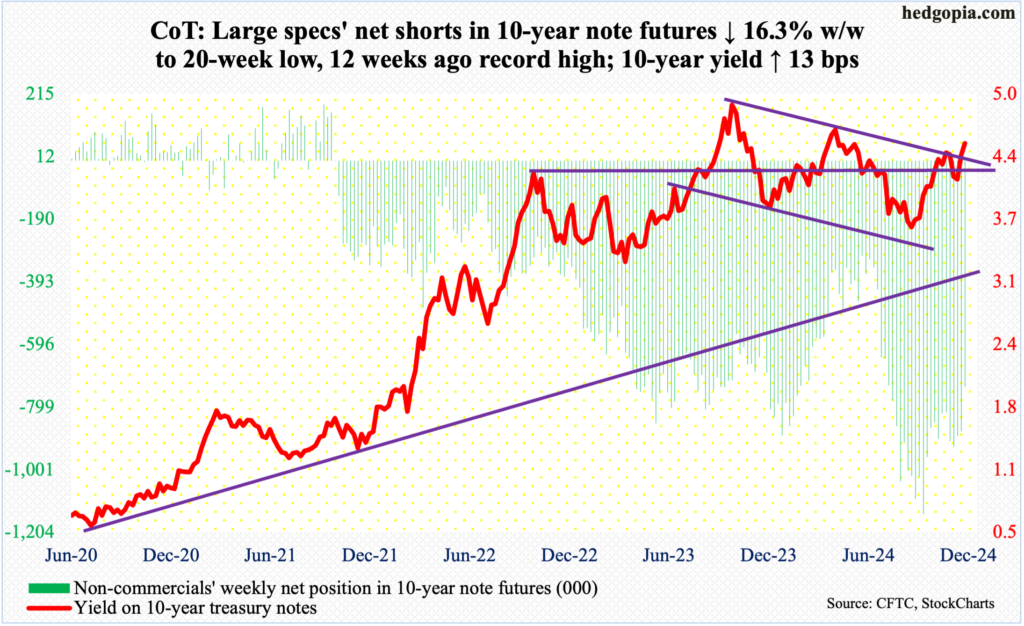
In the 12 months to November, headline and core PCE (personal consumption expenditures) increased 2.44 percent and 2.82 percent respectively. These rates of growth are much softer than the four-decade highs of 7.25 percent and 5.65 percent recorded in June and February of 2022. At the same time, the recent trend is not encouraging, with the headline and core last month at four- and seven-month highs respectively. The report was released Friday, vindicating Wednesday’s guidance by the Federal Reserve, when the fed funds rate was cut by 25 basis points to a range of 425 basis points to 450 basis points as expected but the Summary of Economic Projections (SEP) threw markets a curveball.
The SEP, the accompanying statement and Chair Jerome Powell’s press conference were all decidedly hawkish. In 2025, the unemployment rate is now expected to come in at 4.3 percent, down from 4.4 percent projected in September, while real GDP growth was revised up from two percent to 2.1 percent; more importantly, core PCE was revised up to 2.5 percent from 2.2 percent. In fact, the SEP does not expect core PCE – the central bank’s favorite – to hit the stated goal of two percent until 2027.
Inflation concerns are back on the agenda. The median FOMC member now expects just a half-percentage point of cuts next year, versus 100 basis points expected in September. In the aggregate, the economy is performing much stronger than expected, even as inflation is proving sticky.
Markets are adjusting. Equities and bonds took it on the chin, even as the fed funds futures now anticipate only one 25-basis-point cut next year. Going into the meeting, these traders saw two cuts next year. In this scenario, equities, with back-to-back blockbuster years, have a lot of adjustment to do in the months and quarters ahead.
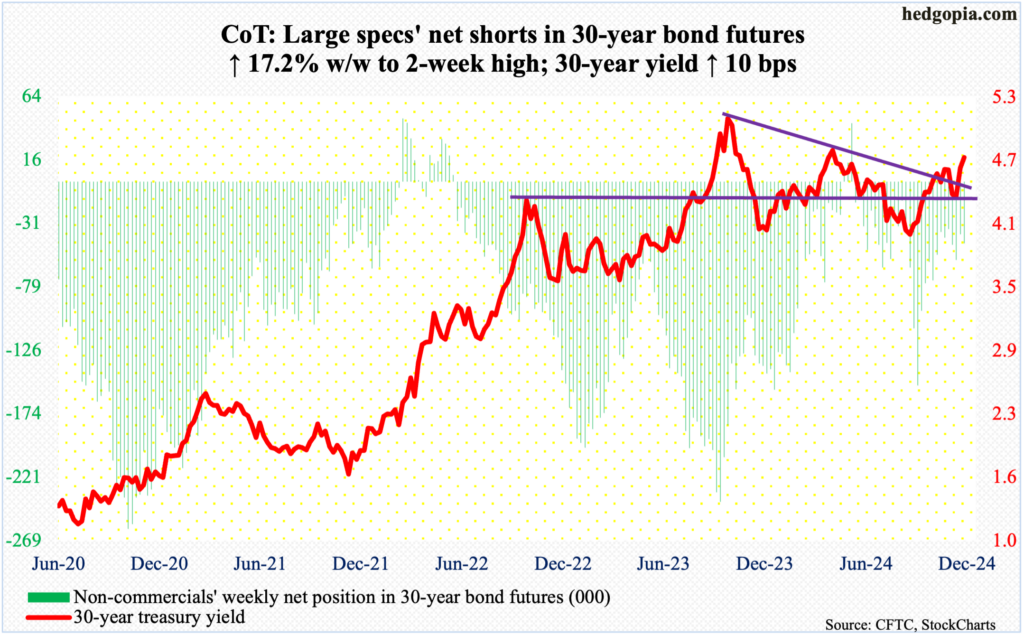
30-year bond: Currently net short 46.3k, up 6.8k.
(Click on image to enlarge)
Major US economic releases for next week are as follows. Markets are closed Wednesday for observance of Christmas holiday.
On Tuesday, durable goods orders (November) and new home sales (November) are on deck.
In October, orders for non-defense capital goods ex-aircraft – proxy for business capex plans – dropped 0.2 percent month-over-month to a seasonally adjusted annual rate of $73.7 billion, which is not too far away from last December’s record $74 billion.
Sales of new homes tumbled 17.1 percent m/m in October to 610,000 units (SAAR) – a 23-month low. September’s 738,000 was a 16-month high.
WTI crude oil: Currently net long 232.8k, up 51.4k.
(Click on image to enlarge)
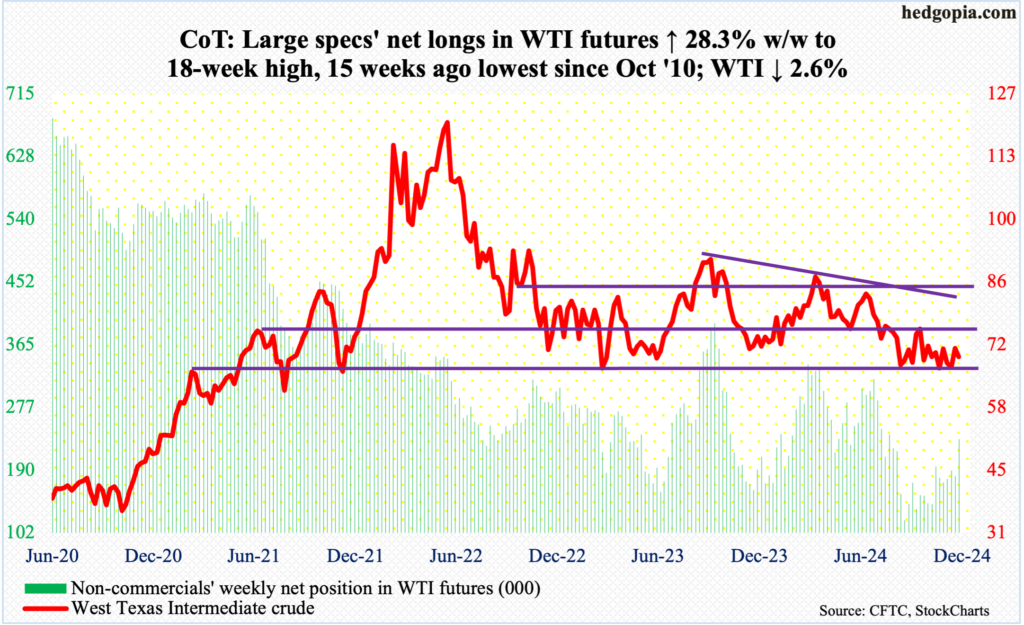
Last week, oil bulls defended crucial support at $66-$67, which for more than three months routinely attracted buying interest, closing at $71.29. For months, West Texas Intermediate crude was rangebound between $71-$72 and $81-$82. Easing back into the range has proven difficult, and this continued.
This week, WTI began the week with an intraday high of $70 on Monday and headed lower, finishing down 2.6 percent to $69.46/barrel. Bulls are on the defensive but deserve the benefit of the doubt so long as $66-$67 is intact.
In the meantime, US crude production in the week to December 13 decreased 27,000 barrels per day week-over-week from record 13.631 million b/d. Crude imports increased 665,000 b/d to 6.6 mb/d. As did gasoline inventory which grew 2.3 million barrels to 222 million barrels. Stocks of crude and distillates, on the other hand, went the other way – respectively down 934,000 barrels and 3.2 million barrels to 421 million barrels and 118.2 million barrels. Refinery utilization fell six-tenths of a percentage point to 91.8 percent.
E-mini S&P 500: Currently net short 39.9k, down 43.5k.
(Click on image to enlarge)
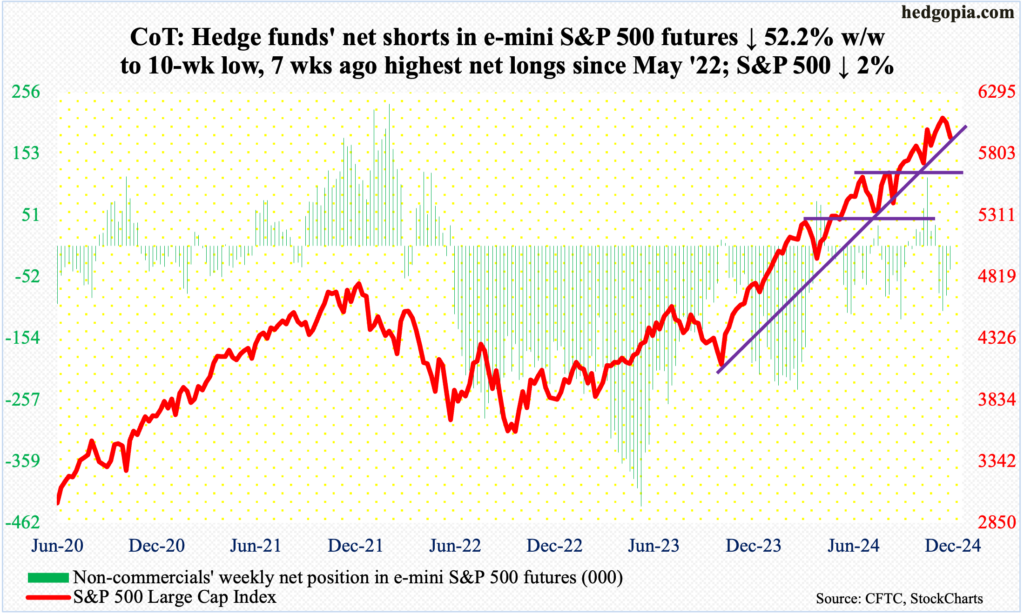
Equity bulls used the Fed’s hawkish shift to lock in some of their gains. Through the new intraday high of 6100 posted on the 6th, the S&P 500 was up 27.9 percent for the year. This follows last year’s 24.2-percent jump. This has helped push up sentiment and valuations into extended territory (more on this here).
This week, the large cap index gave back a couple of percent. But at Friday’s low, it was down as much as 3.6 percent ticking 5832, before bids showed up at trendline support from October last year, ending at 5931 – just above the 50-day moving average at 5927.
Provided horizontal support at 5870s remains intact, the daily has room to head higher.
Euro: Currently net short 65.9k, down 9.7k.
(Click on image to enlarge)
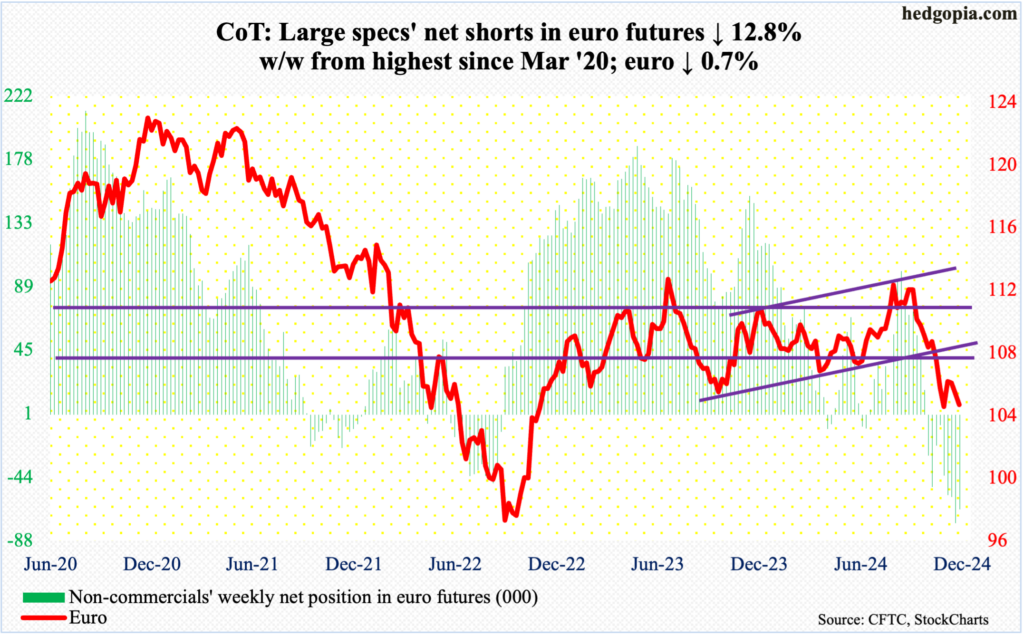
A month ago on November 22, after dropping in seven of eight weeks, the euro bottomed at $1.0332. This preceded a sharp fall starting September 30 after facing rejection at $1.12 for six consecutive weeks. This Wednesday, last month’s low was tested – successfully – as the currency tagged 1.0333, which the bulls embraced. The week ended at $1.0428, still down 0.7 percent.
A rally is possible in the sessions ahead, in which case $1.08 is worth watching, with the 200-day at $1.0823 and the sharply falling 50-day at $1.0644.
Gold: Currently net long 262k, down 13.5k.
(Click on image to enlarge)
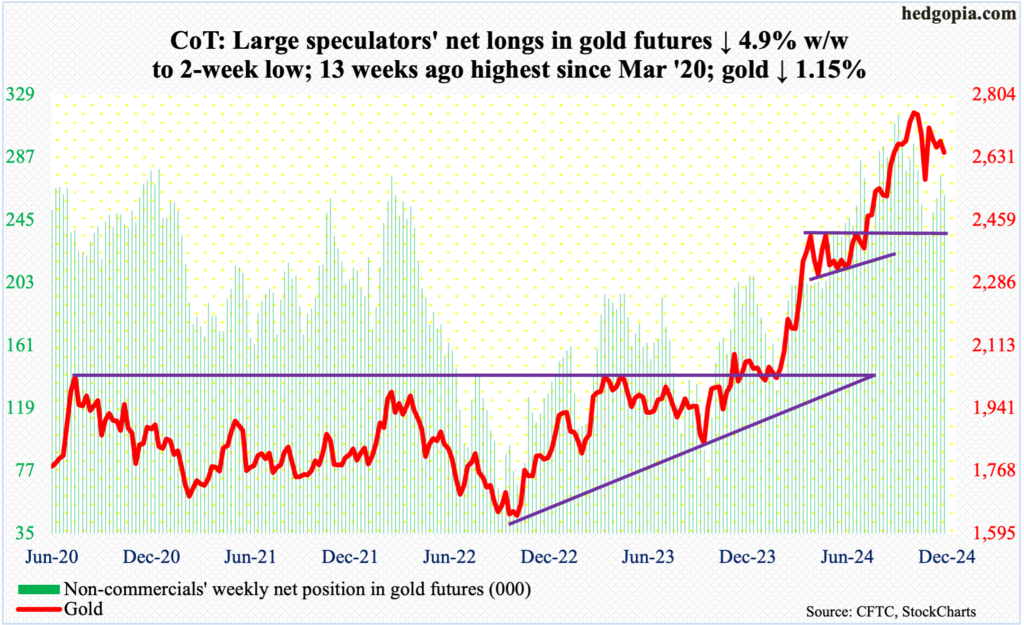
Last week, gold added 0.6 percent but left a large upper wick; a lower high of $2,761 was formed versus a new intraday high of $2,802 on October 30. The downward momentum continued this week, as the metal dropped 1.2 percent to $2,645/ounce. Gold bugs at the same time can take solace in the fact that buying interest showed up at the nearest support.
On the way to the October peak, there were several breakouts – $2,610s, $2,540s-50s and $2,440s-50s. These levels can now provide support. In the last three sessions this week, bids were waiting around $2,600.
The metal can rally. If the 50-day at $2,684 is recaptured, trendline resistance from the October high lies at $2,750.
Nasdaq (mini): Currently net long 36.1k, up 509.
(Click on image to enlarge)
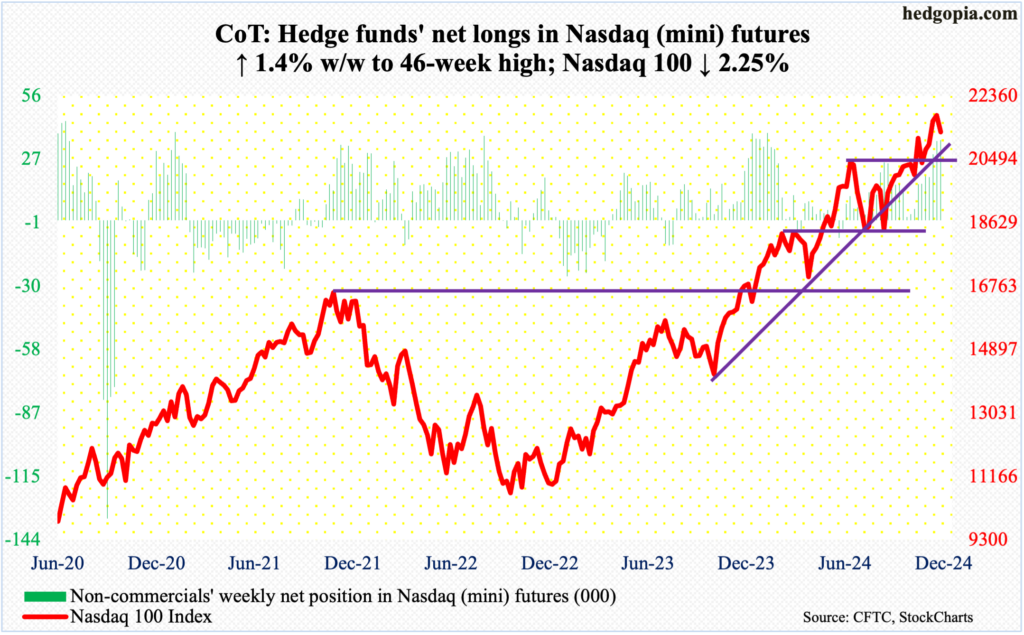
The Nasdaq 100 had a wild week, which began with Monday’s fresh all-time high of 22133 and ended with Friday’s low of 20914. That low – just above the 50-day at 20826 – was bought, and the week ended at 21289, still down 2.3 percent. For consolation for the tech bulls, the index was down four percent at Friday’s low.
This week’s loss came after a four-week winning streak. Despite this, unless they lose 20500s, bulls are likely to try to take advantage of a seasonally favorable – and holiday-shortened – period next week.
Russell 2000 mini-index: Currently net short 416, down 1.7k.
(Click on image to enlarge)
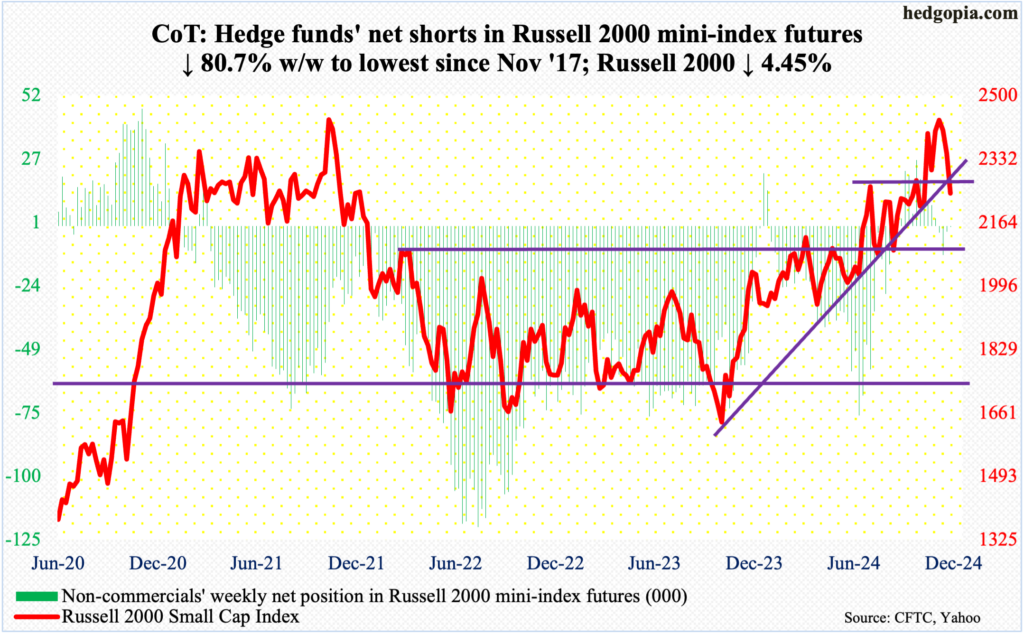
Small-caps were slapped hard. Going into the FOMC week, the Russell 2000 already had two down weeks. This followed a new all-time high of 2466 on November 25 – past the prior high of 2459 from three years ago; in the week the new high was posted, a spinning top showed up on the weekly.
This week, the prospects of fewer interest-rate cuts ahead coaxed the bulls into locking in gains. At one time Friday, the small cap index was down 6.5 percent for the week. Then, bids showed up just under 2200, ending the week down 4.5 percent to 2242. The index nevertheless finished under 2260s, which goes back to mid-July and which now should act as resistance. The index has also breached trendline support from October last year.
US Dollar Index: Currently net long 5.6k, up 8.9k.
(Click on image to enlarge)
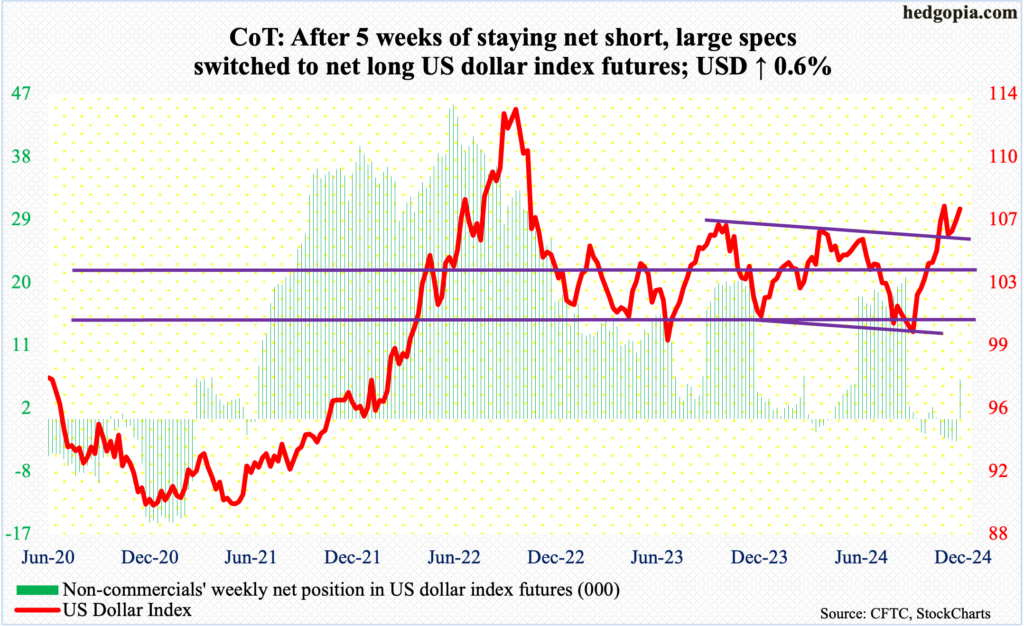
On the back of the Fed’s new interest-rate outlook, dollar bulls rallied the US dollar index to a two-year high but were unable to hang on to all of the gains, rising as high as 108.28 intraday Friday but ending the week at 107.35, up 0.6 percent. This was an 11th up week in 12. The index began to reverse higher on September 30, after having gone sideways just under 100 for several sessions.
The index closed above 107 but failed to take out 108.07 which was hit on November 22.
The daily looks like it wants to head lower. Once 107 is breached, the next level of decent support lies at 105.70s.
VIX: Currently net short 49k, up 3.8k.
(Click on image to enlarge)
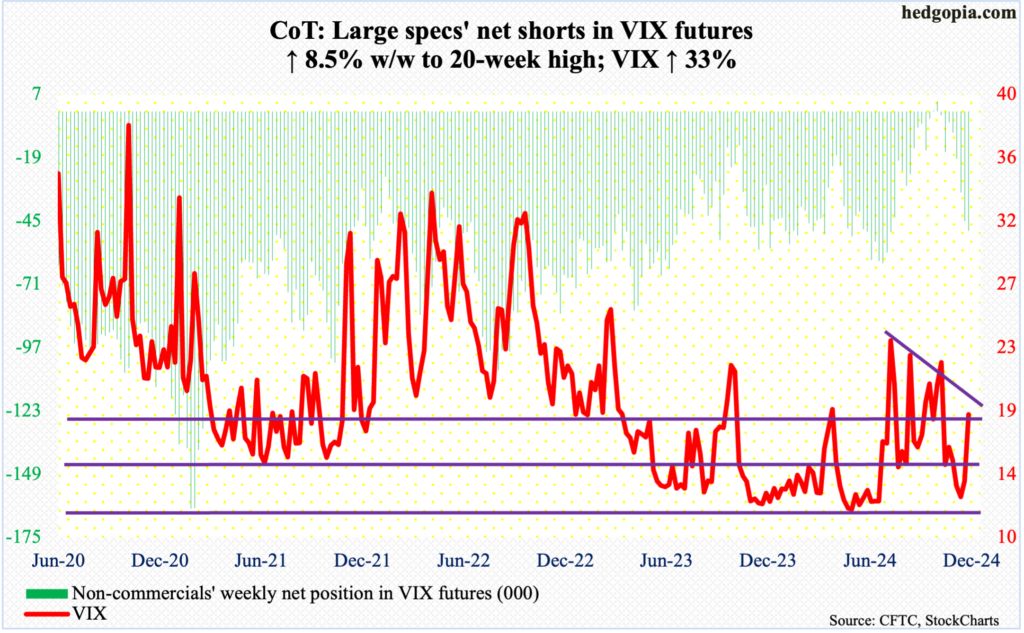
VIX shot up on Wednesday but ended up flashing a spike reversal on the weekly. At that session’s intraday high, the volatility index was up 14.51 points for the week to 28.32, which was the highest print since August’s spike, but gave back a significant amount of the rally to end the week at 18.32, up 4.55 points.
In the near term, VIX’s path of least resistance is down.
More By This Author:
S&P 500 On Pace For Back-To-Back 20%-Plus Gains
CoT And The Future Thru Futures: What We're Gleaning From The Latest Report
Elevated Investor Sentiment And Volatility/Options Dynamics Probably Favor Contrarians
This blog is not intended to be, nor shall it be construed as, investment advice. Neither the information nor any opinion expressed here constitutes an offer to buy or sell any security or ...
more


