CoT And The Future Thru Futures: What We're Gleaning From The Latest Report
Following futures positions of non-commercials are as of December 10, 2024.
10-year note: Currently net short 875.7k, down 16.2k.
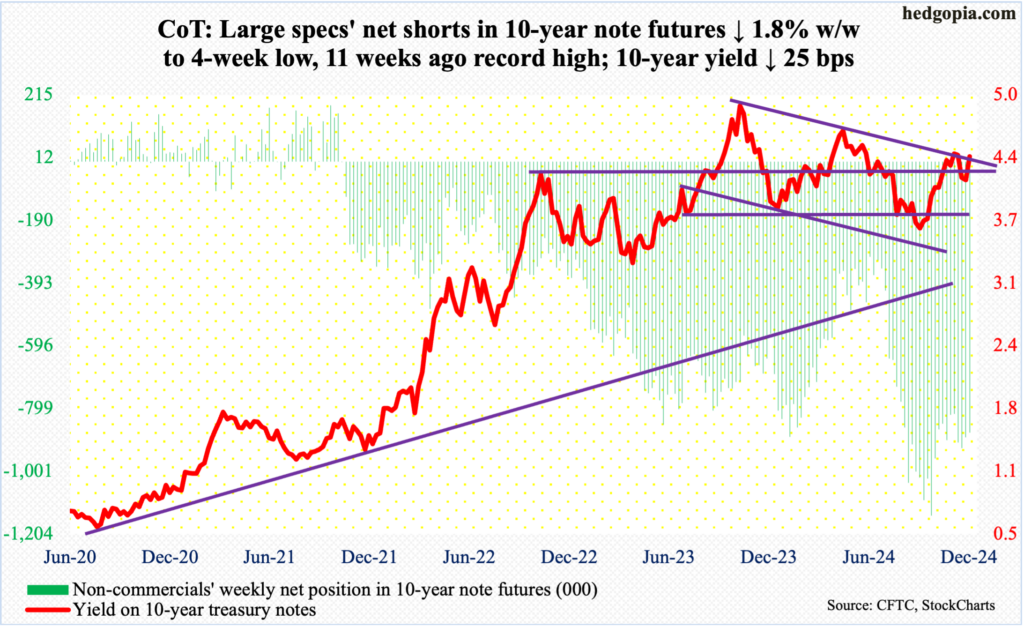
The futures market is now factoring in a 96-percent chance of a 25-basis-point reduction when the FOMC meets next week. In recent days, various FOMC members too have telegraphed that they are comfortable with a cut in the year’s last meeting. This week’s stronger-than-expected inflation for November – both consumer and wholesale – thus did not change these traders’ outlook for next week.
Next year can prove to be tricky. The fed funds rate currently stands at a range of 450 basis points to 475 basis points, down 75 basis points from the September high. Next year, another 50 basis points of easing is currently priced in. This is substantially different from just a few weeks ago when the benchmark rates were expected to end 2025 under three percent.
It is possible that come next week FOMC members’ projection deviates from this, as they try to send a somewhat hawkish message. They are probably not happy with how sticky inflation is proving to be and would definitely not want a repeat of the 1970s when a resurgence in inflation became a real headache for policymakers, not to mention the general population.
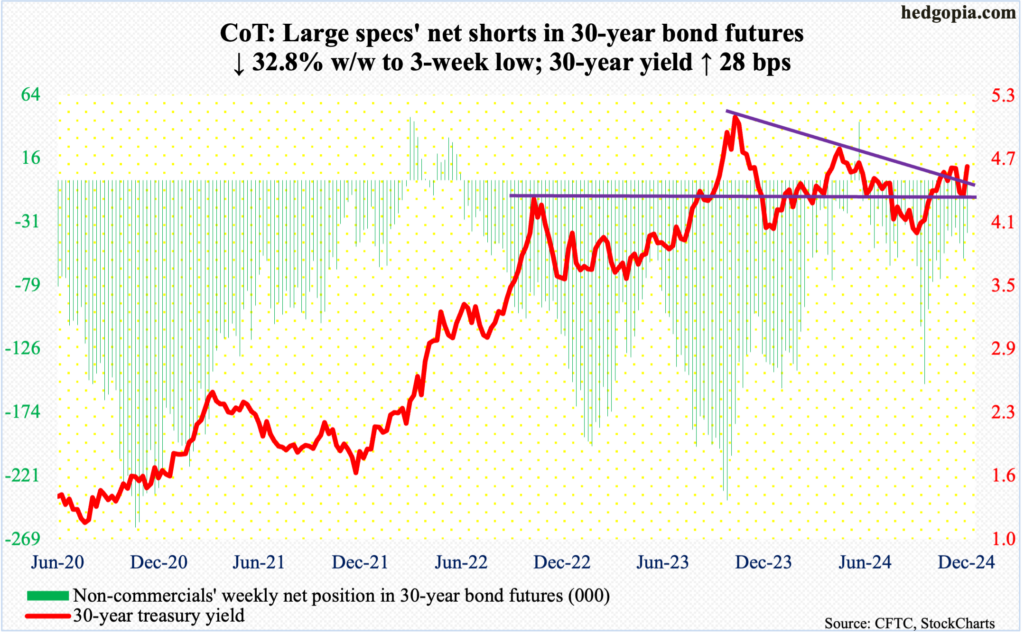
30-year bond: Currently net short 39.5k, down 19.3k.
Major US economic releases for next week are as follows.
Retail sales (November), industrial production (November) and the NAHB Housing Market Index (December) are scheduled for Tuesday.
October retail sales were up 0.4 percent month-over-month to a seasonally adjusted annual rate of $718.9 billion – a record.
Capacity utilization in October contracted 0.4 percent m/m to 77.1 percent, which was the lowest since April 2021.
Homebuilder optimism firmed up three points m/m in November to 46 – a seven-month high.
Housing starts (November) will be reported Wednesday. October starts decreased 3.1 percent m/m to 1.31 million units (SAAR). This was a three-month low. July’s 1.26 million was a four-year low.
Thursday brings GDP (3Q24, second revision), corporate profits (3Q24, revised) and existing home sales (November).
The second print showed real GDP in 3Q24 expanded at an annualized rate of 2.8 percent.
Preliminarily, 3Q24 corporate profits with inventory valuation and capital consumption adjustments dropped 0.3 percent from the prior quarter’s record $3.82 trillion.
Sales of existing homes increased 3.4 percent m/m in October to 3.96 million, matching July’s number.
Personal income/spending (November) and University of Michigan’s consumer sentiment index (December, final) are on tap for Friday.
In the 12 months to October, headline and core PCE (personal consumption expenditures) rose 2.3 percent and 2.8 percent, which respectively set a three- and six-month high. They peaked in 2022 at 7.3 and 5.7 percent in June and February, in that order.
December’s preliminary reading showed consumer sentiment rose 2.2 points m/m to 74. This set an eight-month high.
WTI crude oil: Currently net long 181.4k, down 7.4k.
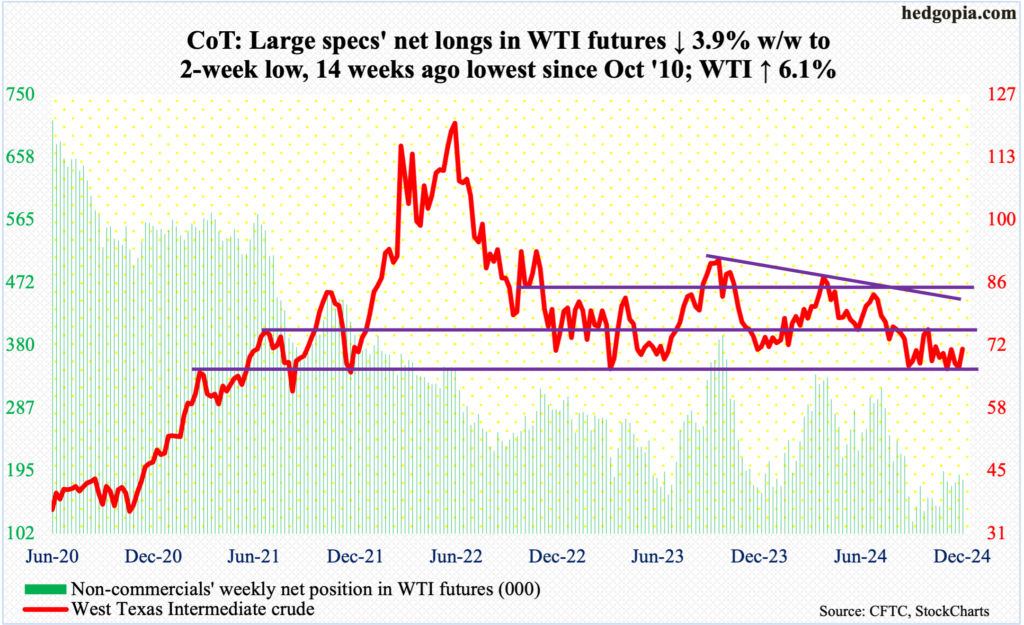
Once again, oil bulls managed to defend crucial support at $66-$67. For more than three months now, this price point has routinely attracted buying interest, although subsequent rallies for the most part have not amounted to much.
Last Friday, West Texas Intermediate crude closed at $67.20. This Monday, it ticked $67.08 intraday, and bids showed up. The week closed up 6.1 percent to $71.29/barrel.
This week’s gains have pushed the crude into a months-long range between $71-$72 and $81-$82. The 50-day moving average at $70.23 was reclaimed Friday. More gains are possible ahead. In the best of circumstances for the bulls, trendline resistance from September last year lies at $78.
In the meantime, US crude production in the week to December 6 increased 118,000 barrels per day to 13.631 million b/d – a record. Crude imports decreased 1.3 mb/d to six mb/d. As did crude inventory which declined 1.4 million barrels to 422 million barrels. Stocks of gasoline and distillates, on the other hand, went the other way – respectively up 5.1 million barrels and 3.2 million barrels to 219.7 million barrels and 121.3 million barrels. Refinery utilization fell nine-tenths of a percentage point to 92.4 percent.
E-mini S&P 500: Currently net short 83.3k, down 25.3k.
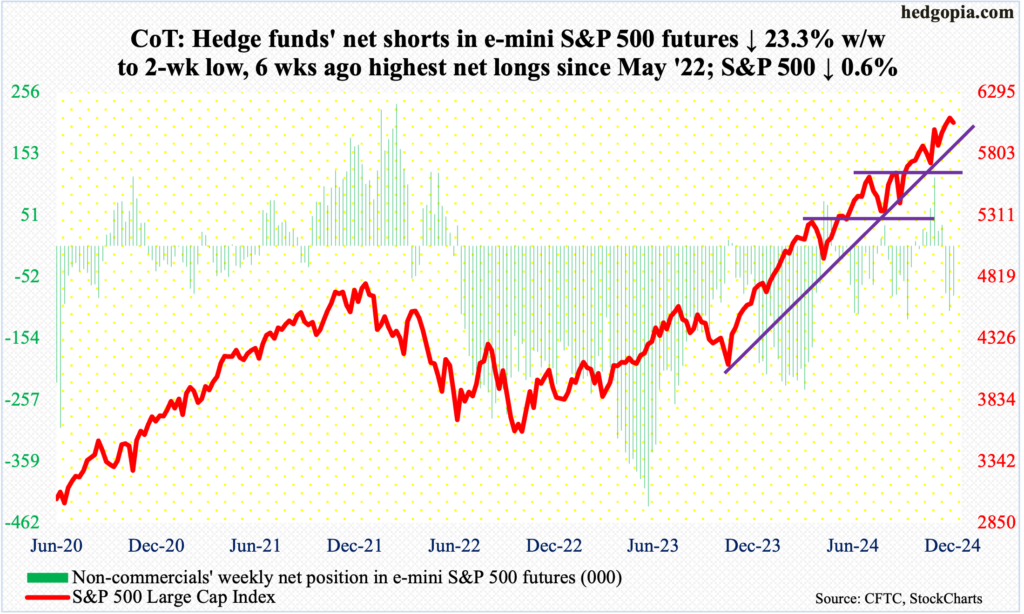
After three up weeks, equity bulls were unable to stop the S&P 500 (6051) from shedding 0.6 percent this week. Last Friday, the large cap index posted a new intraday high of 6100. By then, it was up 27.9 percent for the year. This follows last year’s 24.2-percent jump.
Not surprisingly, investor sentiment is giddy, with several indicators flashing yellow, if not outright red (more on this here). It is times like these that it can pay off to become a contrarian, although timing a top is difficult, as it is more a process.
For now, 6020s is where a bull-bear duel likely unfolds next week. A breach can hurriedly result in a test of the 50-day at 5907.
Euro: Currently net short 75.6k, up 18.1k.
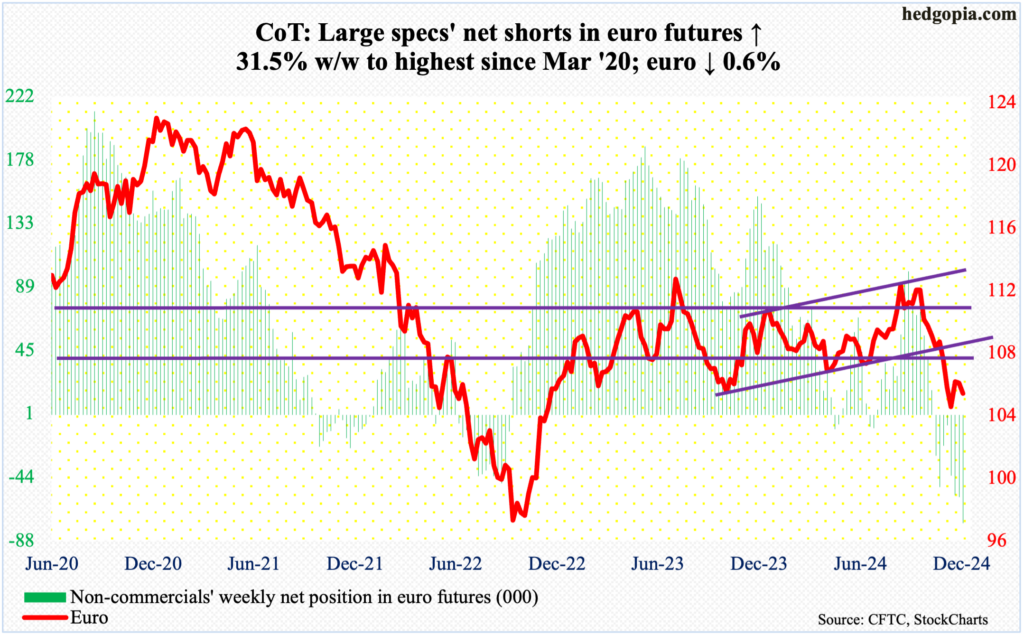
Four weeks ago, after dropping in seven of eight weeks, the euro bottomed at $1.0332. This preceded a sharp fall starting September 30 after facing rejection at $1.12 for six consecutive weeks.
It is proving tough rallying off that November 22nd bottom. Last Friday, the currency tagged $1.0630, before coming under pressure the first four sessions this week. This Friday’s 0.3-percent rally was not enough to stop the week from bleeding 0.6 percent.
The European Central Bank on Thursday reduced its benchmark rates by 25 basis points to three percent, and more cuts are priced in as Eurozone economic activity is weakening.
This week, the euro closed at $1.0503. Horizontal support at $1.05 goes back nearly a decade. As things stand, stability around this level should be considered a win for euro bulls.
In the event of a rally, $1.08 is worth watching, with the sharply falling 50-day at $1.0696.
Gold: Currently net long 275.6k, up 15.9k.
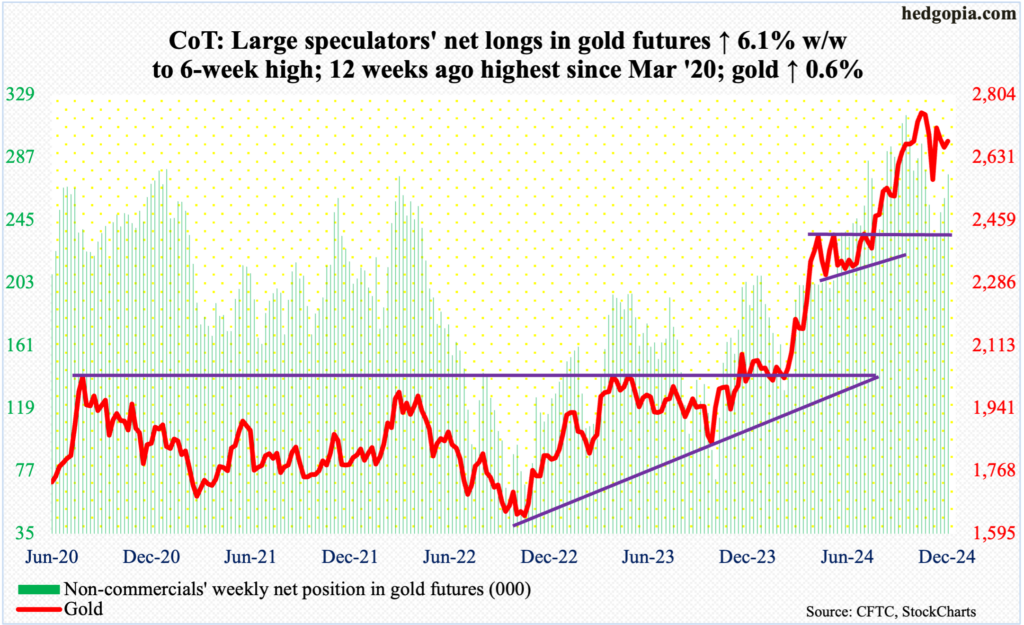
Gold rallied hard in the first three sessions, tagging $2,760 by Wednesday, but only to then unravel to finish the week up only 0.6 percent to $2,676/ounce. As a result, the weekly left a rather large upper wick. Seven weeks ago, when the metal reached a new intraday high of $2,802 on October 30, a gravestone doji formed on the weekly. This week’s candle has a similar look to it.
More selling pressure likely lies ahead. On the way to the October peak, there were several breakouts – $2,610s, $2,540s-50s and $2,440s-50s, which can now provide support.
Nasdaq (mini): Currently net long 35.6k, up 5.9k.
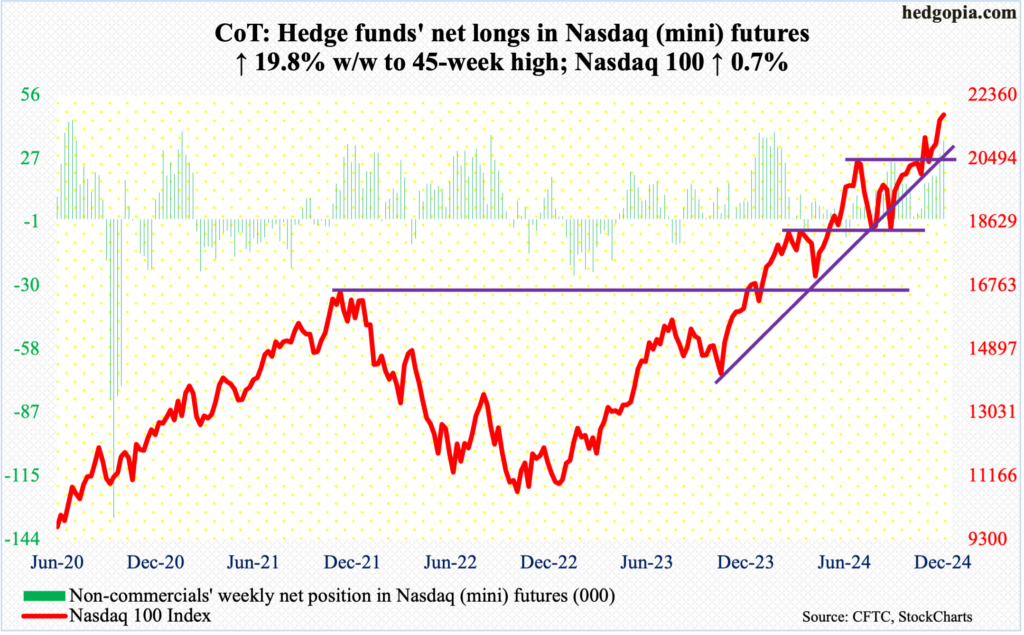
Unlike the S&P 500, the Nasdaq 100 continued to rally this week, up 0.7 percent to put up a four-week winning streak. That said, tech bulls were unable to hang on to Friday’s intraday high of 21887, finishing the week at 21780, with the session ending with a long-legged doji.
After stalling at 21100s for a couple of sessions, the Nasdaq 100 gapped up and broke free last Tuesday, followed by more gains this week.
Amidst these new – and newer highs – momentum continues to be sluggish. The daily RSI has not crossed 70 since July, with Friday ending at 66.21. This is not going to bode well from the mid- to long-term perspective, but this is yet to matter in the short-term, as the price action continues to trumpet these divergences.
With seasonal tailwind at their back, the bulls deserve the benefit of the doubt so long as the index remains above 20500s.
Russell 2000 mini-index: Currently net short 2.2k, down 9.4k.
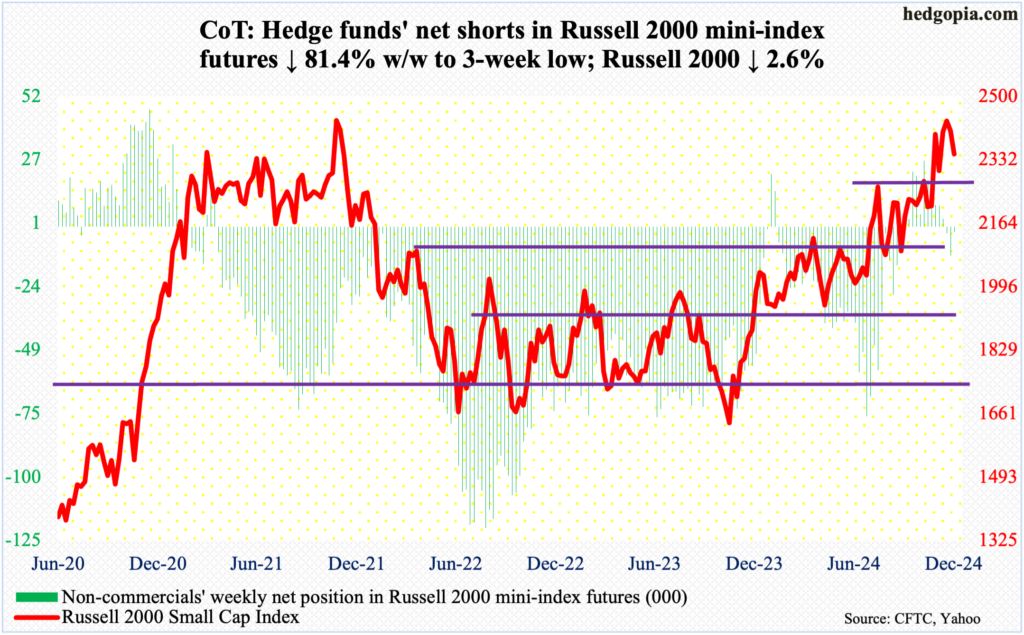
No sooner did the Russell 2000 print a new all-time high of 2466 on November 25 – past the prior high of 2459 from three years ago – than selling pressure intensified. In the week when the new high was posted, a spinning top showed up on the weekly. This has been followed by two weekly declines – down 1.1 percent last week and down 2.6 percent this week to 2347.
Small-cap bulls can take solace in the fact that the index remains above horizontal support at 2260s, which goes back to mid-July. The small cap index broke out of it on November 6, followed by a retest on the 19th. Another retest is just a matter of time.
US Dollar Index: Currently net short 3.2k, up 170.
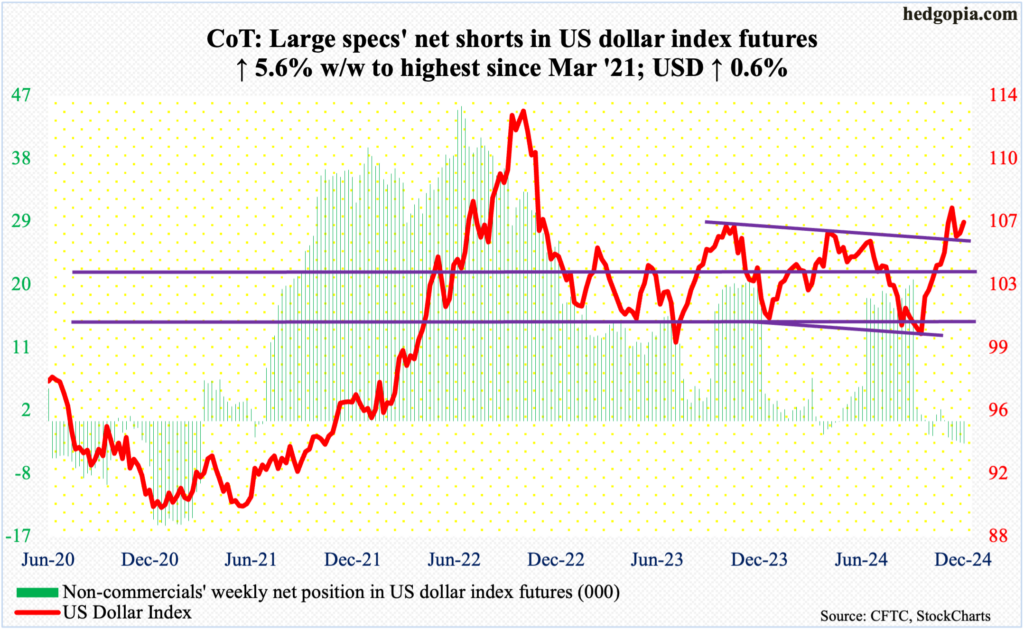
Both dollar bulls and bears held their ground this week. Dollar bulls three weeks ago were unable to defend 107. Since then, the US dollar index has rallied the last two weeks, but it has been unable to reclaim 107.
This week, the index rallied 0.6 percent to 106.68, with Friday’s intraday high of 106.88 subtly attracting offers. With that said, horizontal support at 105.70s was defended as early as Monday; More downside pressure is likely once this level is breached.
VIX: Currently net short 45.2k, up 12k.
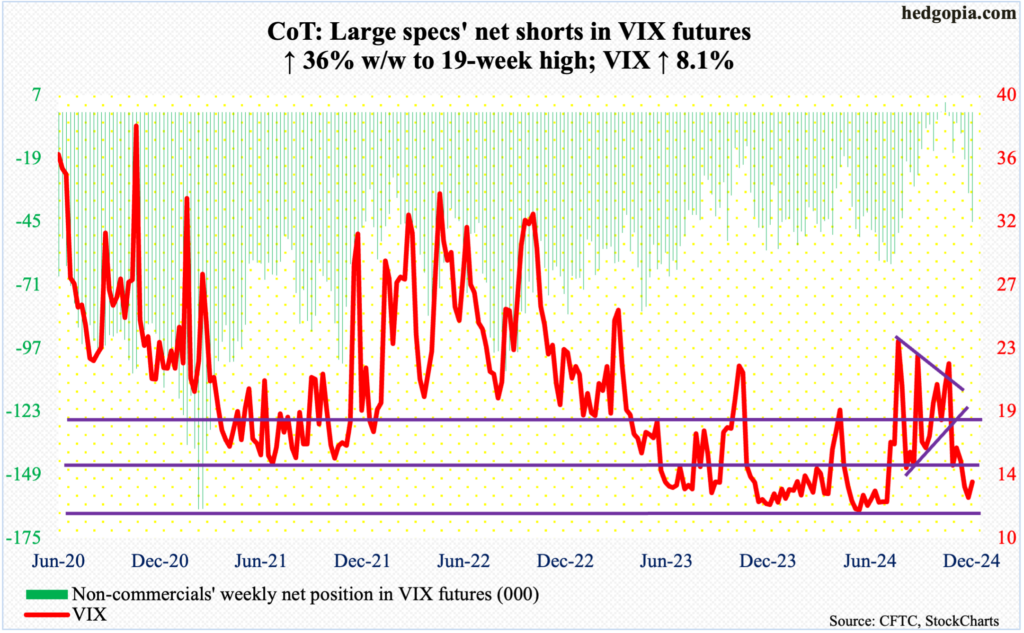
Daily Bollinger bands are tightening. This tends to precede a sharp move – either up or down.
Just last Friday, VIX touched 12.70 intraday, which was the lowest in nearly five months. Support at 12 is crucial. This week, the volatility index closed at 13.81, up 1.04 points. This was the first up week in four.
With this as a background, if a sharp move is coming, odds favor it will be to the upside.
Thanks for reading!
More By This Author:
Elevated Investor Sentiment And Volatility/Options Dynamics Probably Favor Contrarians
The Future Thru Futures: What We're Gleaning From The Latest CoT Report
New Intraday High On Russell 2000 Last Week
This blog is not intended to be, nor shall it be construed as, investment advice. Neither the information nor any opinion expressed here constitutes an offer to buy or sell any security or ...
more


