WTI Slumps On Soft Demand From US And China As Traders Brace For US CPI

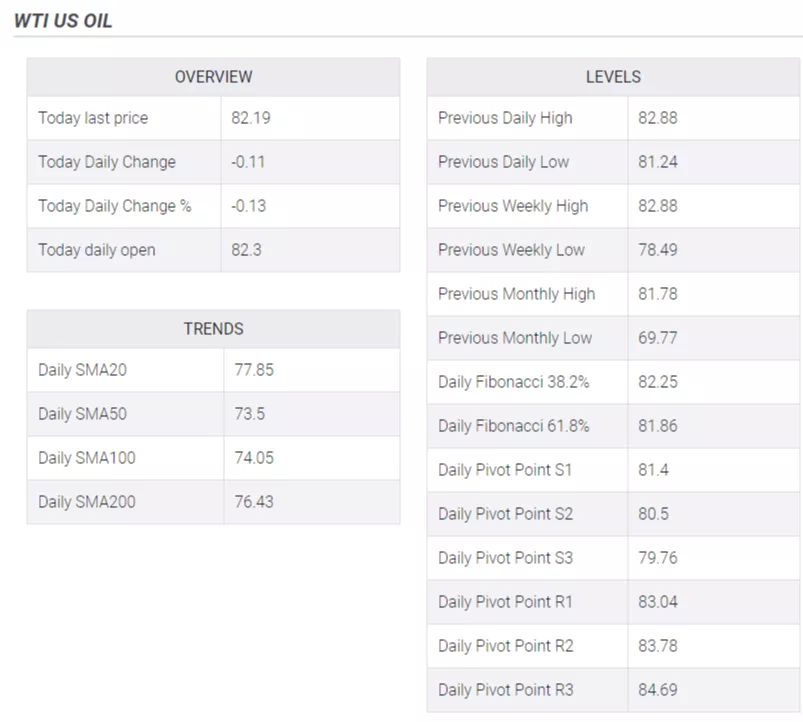
Western Texas Intermediate (WTI), the US crude oil benchmark, fell 0.16% on Monday due to traders bracing for weaker demand from the United States (US) and China. Hence, WTI is trading at $82.45, below its opening price, after hitting a daily high of $83.26.
Seasonal demand dip and China’s sluggish recovery pressure oil, though Saudi Arabia’s production cut offers some support
Market sentiment remains upbeat as Wall Street closed with gains. The end of summer vacations in the US is one of the drivers that weakened oil prices as a result of lower demand due to seasonal factors. In the meantime, China’s struggles to recover after lifting Covid-19 zero-tolerance restrictions supported oil’s rally, but its recovery slowed as the year progressed.
Meanwhile, after detecting a leak in central Poland, a pipeline that delivers oil from Poland to Europe would resume oil flows on Tuesday, easing worries about supply constraints.
Although those reasons would weigh WTI’s price, Saudi Arabia’s extension of its 1 million crude oil production cut to September cushioned the oil price fall. That, alongside Russia’s commitment to cut its exports by 300K barrels per day (bpd).
WTI traders focus the rest of the week on the US Consumer Price Index (CPI) report for July. A rise in prices in the United States (US), could trigger a hawkish reaction by the US Federal Reserve (Fed), which could remain increasing rates, augmenting demand for the greenback. Consequently, a strong US Dollar would weigh on US Dolllar-denominated assets, like WTI.
WTI Price Analysis: Technical outlook
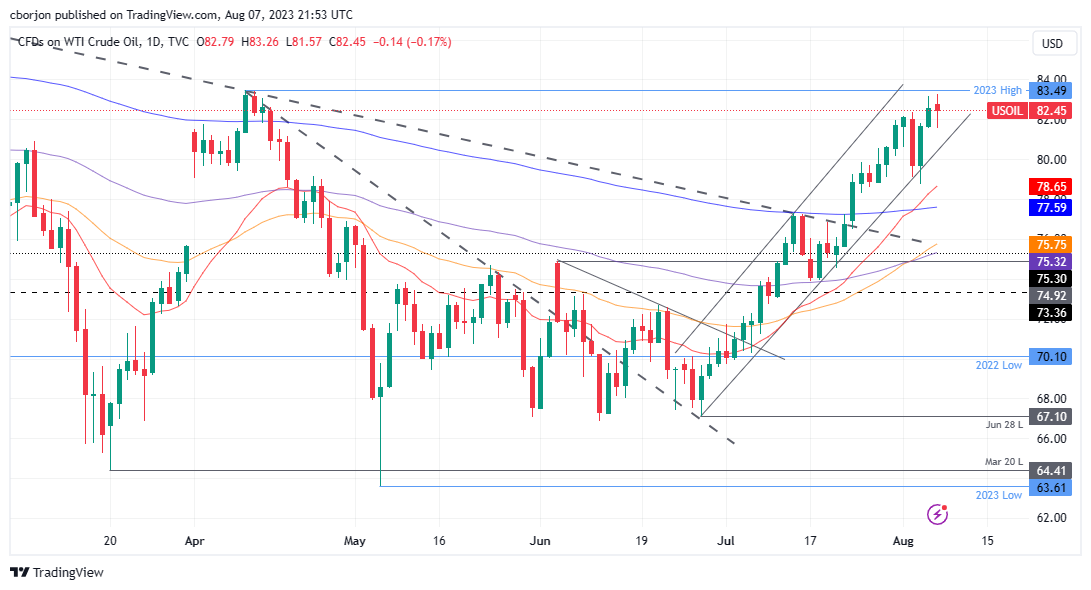
From a daily chart perspective, WTI is in an uptrend though it remains shy of breaking above the $84.00 per barrel figure, which could exacerbate a test of the November 11, 2022, daily high of $90.08. Nevertheless, Monday’s reversal day printed a ‘spinning-top’ candlestick, suggesting that buyers are losing momentum, ahead of breaking above the year-to-date (YTD) high of $83.49. That said, if WTI breaks above the latter, that would expose $84.00, followed by the psychological $84.50 area, before testing $85.00. Conversely, if WTI drops below Monday’s low of $81.57, that could trigger a correction towards the $80.00 per barrel, followed by the 20-day EMA.
(Click on image to enlarge)


More By This Author:
Silver Price Analysis: XAG/USD Plunged Below The 100-day SMA As The USD Recovers
USD/JPY Climbs On Strong USD After Last Week’s US Nonfarm Payrolls Data
USD/CAD Price Analysis: Refreshes Two-Month High Around 1.3400 As Fed Delivers Hawkish Guidance
Disclaimer: Information on these pages contains forward-looking statements that involve risks and uncertainties. Markets and instruments profiled on this page are for informational purposes only ...
more


