

Image Source: Unsplash
- USD/CAD continues a four-day winning streak as investors hope that the Fed would raise interest rates further.
- A weak Canadian labor market report could allow the BoC to consider a steady interest rate policy ahead.
- USD/CAD refreshes a two-month high around 1.3400 and prints a fresh swing high.
The USD/CAD pair prints a fresh two-month high near the round-level resistance of 1.3400 in the European session. The Loonie asset extends its four-day winning streak as investors hope that the Federal Reserve (Fed) could continue hiking interest rates further.
Fed Governor Michelle Bowman said over the weekend that the US central bank will raise interest rates further to bring inflation down. This provides strength to the US Dollar Index (DXY) and pushes it above 102.00.
Meanwhile, the Canadian Dollar comes under pressure as the labor market witnessed a drop of 6.4K payrolls in July against expectations of 21.1K fresh additions. The Unemployment Rate jumped to 5.5% as expected from June’s reading of 5.4%. A weak Canadian labor market report could allow the Bank of Canada (BoC) to consider a steady interest rate policy ahead.
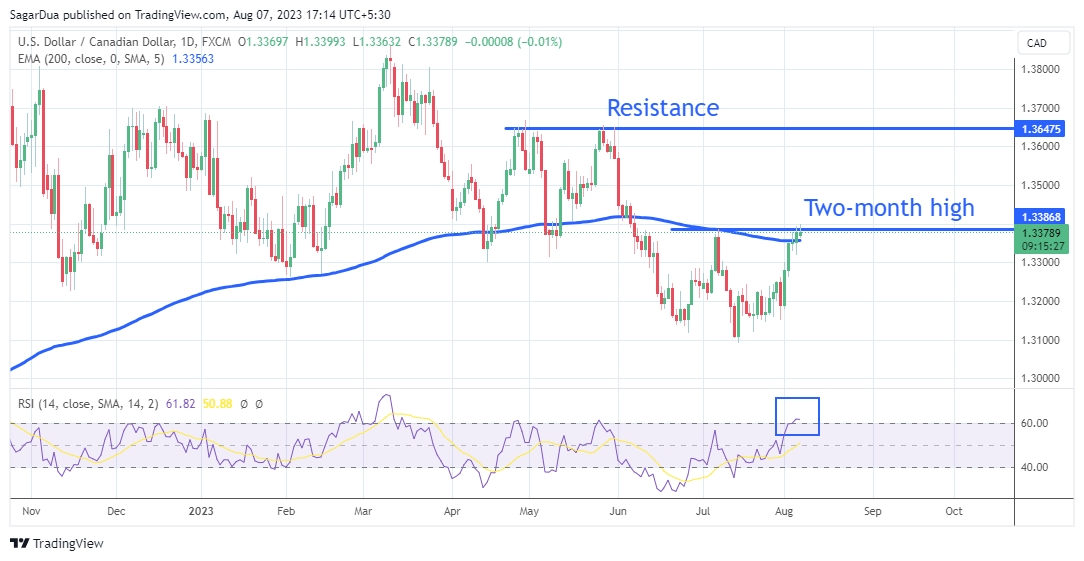
USD/CAD refreshes a two-month high around 1.3400 and prints a fresh swing high on a daily chart. The Loonie climbs above the 200-period Exponential Moving Average (EMA) at 1.3363, which indicates that the long-term trend turns bullish. Horizontal resistance is plotted from April 23 high around 1.3648.
The Relative Strength Index (RSI) (14) jumps into the bullish range of 60.00-80.00. An upside momentum triggers amid an absence of divergence and an oversold situation.
A decisive break above the intraday high at 1.3400 would drive the asset toward June 05 high at 1.3462 followed by the psychological resistance at 1.3500.
In an alternate scenario, a downside move below July 18 high at 1.3288 would drag the asset toward July 27 low around 1.3160 and July 14 low marginally below 1.3100.
USD/CAD daily chart
(Click on image to enlarge)
USD/CAD
| OVERVIEW | |
|---|---|
| Today last price | 1.3386 |
| Today Daily Change | 0.0008 |
| Today Daily Change % | 0.06 |
| Today daily open | 1.3378 |
| TRENDS | |
|---|---|
| Daily SMA20 | 1.3227 |
| Daily SMA50 | 1.3279 |
| Daily SMA100 | 1.3402 |
| Daily SMA200 | 1.3456 |
| LEVELS | |
|---|---|
| Previous Daily High | 1.3394 |
| Previous Daily Low | 1.332 |
| Previous Weekly High | 1.3394 |
| Previous Weekly Low | 1.3151 |
| Previous Monthly High | 1.3387 |
| Previous Monthly Low | 1.3093 |
| Daily Fibonacci 38.2% | 1.3366 |
| Daily Fibonacci 61.8% | 1.3348 |
| Daily Pivot Point S1 | 1.3334 |
| Daily Pivot Point S2 | 1.3289 |
| Daily Pivot Point S3 | 1.3259 |
| Daily Pivot Point R1 | 1.3408 |
| Daily Pivot Point R2 | 1.3439 |
| Daily Pivot Point R3 | 1.3483 |
More By This Author:
Canada: Signs Of Loosening But Probably Not Enough Yet For The BoCGBP/JPY Price Analysis: Bulls Gave Up, And Bears Retook The 20-Day SMA
USD/CAD Hits Monthly Highs And Reverses After US And Canada Job Reports


Comments
Log in or sign up to join the conversation.