GBP/JPY Price Analysis: Bulls Gave Up, And Bears Retook The 20-Day SMA

Yen. Image Source: Pixabay
- The GBP/JPY currency pair retreated towards the 181.00 area and cleared most of its weekly gains on Friday.
- Investors continue to digest the BoE’s decision on Thursday.
- Governor Ueda committed that the BoJ will be more flexible with the 10-year JGB.
On Friday, the Japanese yen traded mixed against most of its rivals, mainly because of Governor Ueda’s commitment to widening the tolerance of the 10-year JGB. On the other hand, the British pound traded flat after the Bank of England's monetary policy decision on Thursday.
The pound traded mixed against most of its rivals following Thursday’s BoE decision. Overall, rates were hiked by 25 basis points, as expected. The bank no longer expects a recession, but it noted that the monetary policy is now “impacting" economic activity.
Regarding inflation, the BoE forecasts the Consumer Price Index (CPI) will be below 5% by year-end and below 2% by 2025. Still, the question to be asked is whether the bank can achieve a significant drop in prices without a recession.
As for now, according to the World Interest Rates (WIRP) tool, markets are seeing 25 bps hikes in September and December, followed by an additional increase in Q1 of 2024, which would see the terminal rate at 5.75%.
On the yen’s side, the Japanese currency seemed to be gaining traction on the back of the Bank of Japan's (BoJ) comments which stated that the benchmark 10-year Japanese Government Bonds (JGB) will widen from 0.5% to 1.0%, which pushed Japanese yields to their highest levels since 2014. In that sense, markets may anticipate a potential pivot by the BoJ, but the yen will likely remain vulnerable if the bank doesn’t take action.
GBP/JPY Levels to Watch
Per the daily chart, the technical outlook for the GBP/JPY currency pair appeared to be shifting towards neutral to bearish, with signs of bullish exhaustion becoming evident on Friday. The Relative Strength Index (RSI) displayed a negative slope above its midline, while the Moving Average Convergence Divergence (MACD) exhibited negative red bars.
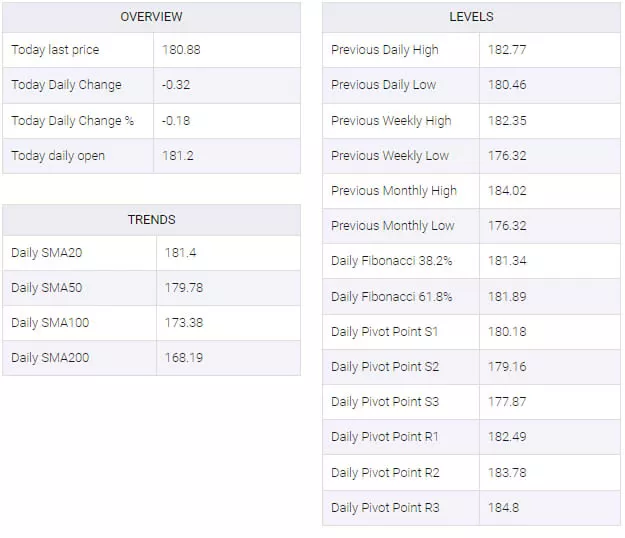
Moreover, the pair rested below the 20-day Simple Moving Average (SMA), but still above the 100-day and 200-day SMAs, indicating that buyers appeared to still hold momentum over the sellers.
- Support levels include 179.85, 179.00, and 178.00.
- Resistance levels include 181.25 (20-day SMA), 182.00, and 183.00.
GBP/JPY Daily Chart
-638267740237845758.png)
GBP/JPY Technical Levels

More By This Author:
USD/CAD Hits Monthly Highs And Reverses After US And Canada Job Reports
GBP/JPY Surrenders A Major Part Of Its Intraday Gains, Manages To Hold Above 181.00 Mark
Silver Price Analysis: Bulls step up following negative data from the US
Disclaimer: Information on these pages contains forward-looking statements that involve risks and uncertainties. Markets and instruments profiled on this page are for informational purposes only ...
more


