
Will Gold’s 12-Year Cycle Send It Much Higher?

Image Source: Pexels
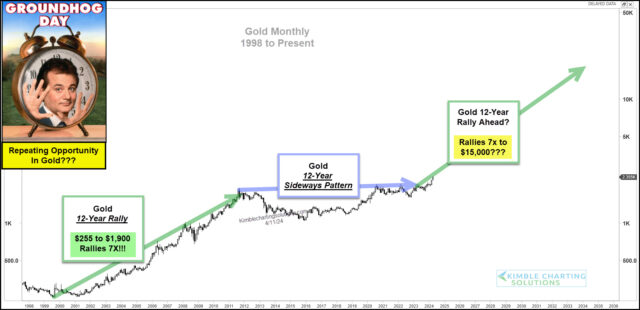
Gold spent the better part of the past 12 years trading in a broad sideways pattern.
This type of price action tends to drive away speculators (and even some convicted bulls). It also meant gold wasn’t getting many “sexy” headlines as investors weren’t overly bullish.
Until now. After a major breakout and move higher, Gold is finally getting some attention.
And if today’s cycle pattern proves true, there may be a lot more attention (and investors) in the future for Gold.
Today’s “monthly” chart of Gold prices highlights a 12-year cycle pattern. As you can see, 12 years higher, followed by 12 years sideways, and now (perhaps) 12 years higher.
If this repeating pattern in Gold holds true, it could offer active investors opportunities now and in the future.
(Click on image to enlarge)
More By This Author:
Gold/US Dollar Attempting Historic Bullish Breakout, Says Joe Friday
Is The S&P 500 Flashing A Spring Sell Signal?
Silver Breakout Adds To Massively Bullish Price Pattern
Disclosure: Sign up for Chris's Kimble Charting Solutions' email alerts--click here.


