
Thoughts For Thursday: Neopredelennost Ta Treamtinnya - Volatility And Jitter
In Russian and Ukrainian, in that order. Lack of anything akin to progress toward ending the war in Ukraine brought continued volatility and caused the stock market to jitter downwards, yesterday.

The S&P 500 closed at 4,602, down 29 points, the Dow closed at 35,229, down 65 points and the Nasdaq Composite closed at 14,442, down 177 points. Yesterday's top most active issues were in the technology and financial sectors, plus Ford and AT&T.
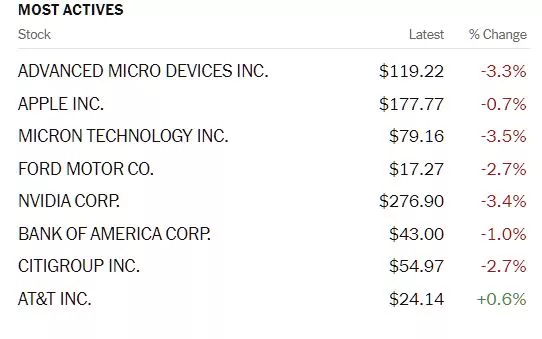
Chart: The New York Times
In morning trading S&P 500 futures are trading up 2 points, Dow futures are trading down 14 points and Nasdaq 100 futures are trading up 45 points.
TalkMarkets contributors are all over the map, with pundits scrambling to explain why a four day rally stopped on Wednesday.
The Staff at Bespoke Investment Group offer the following with regard to Strong Performance At The Tail Ends Of Breadth:
"While the index turned lower today on weaker breadth, the recent rally for the S&P 500 has come on strong breadth resulting in the 10-day advance/decline line to surge to some of the highest readings on record...Generally, lower readings in the 10-day AD line have been followed by stronger returns whereas higher readings have been followed by weaker returns. That is, except for the most elevated readings. Readings in the upper decile have actually been followed by more consistently positive and stronger than normal average returns for the S&P 500. In other words, strong breadth is typically a more negative signal for the S&P 500 going forward, but an extremely strong breadth reading has actually been positive."
See the article for a fully detailed chart.
TalkMarkets contributor Michael Kramer notes Stocks And Oil Drop Following The Weak Job Report.
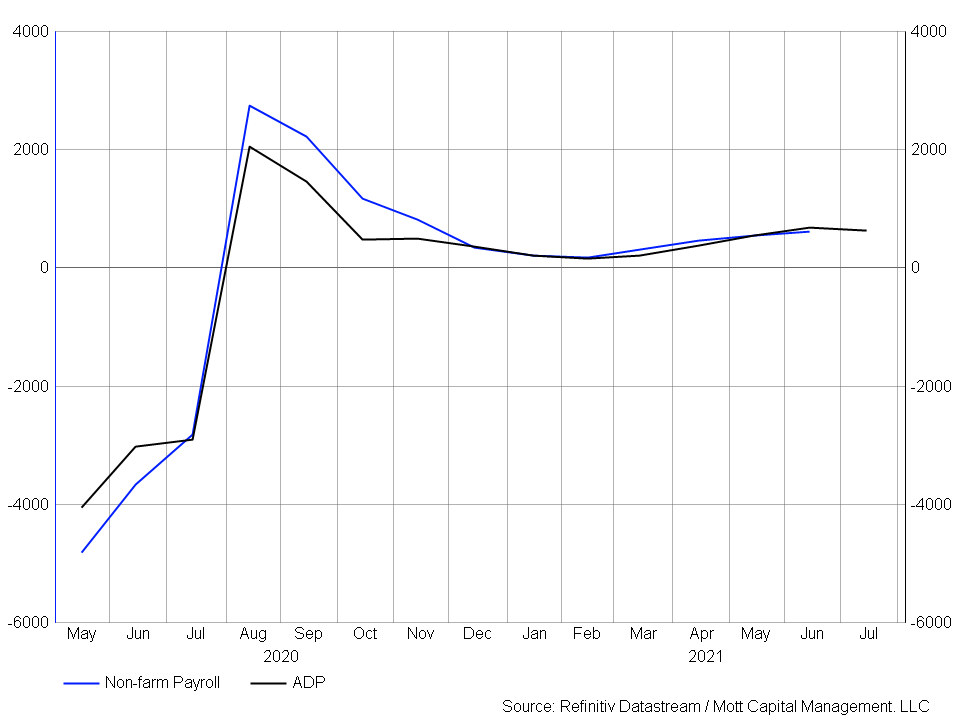
"It was a strange day for the market that started with a big miss on the ADP job report. The ADP has been spotty since the start of the pandemic at predicting the BLS (Bureau of Labor Statistics - Non-farm Payroll) job report than it had been prior. Overall the trends tend to follow one over time, but month to month, it is iffy. So I think it would be tough to say that today’s ADP report is a clear negative for the BLS report. In fact, the April ADP report had a strong reading, and the BLS was weak. So what needs to consider here is that BLS outperformed the ADP in February and March, and ADP outperformed the BLS in April and May, so it seems entirely possible that the BLS outperforms the ADP in June and July."

"But when you look at them on a 4-month moving average, you can see how they come together rather nicely. In fact, a print of up to 1 million jobs in the BLS report would keep things fairly even as they are right now. So, just because the ADP report was a miss, one should not count on the BLS report missing."
"S&P 500 EW (RSP) - The ISM-services index came in hotter than expected, which was a surprise. So overall, the message today on the economy was a push, and it resulted in yields trading sideways and the S&P 500 trading lower some. However, the S&P 500 EW (RSP) was down nearly 1%, and the ETF is getting very close to breaking a major trend line. This needs to be watched very closely. SINCE MAY, the ETF has essentially gone nowhere, and now it is showing some serious signs of weakness.
Oil - Oil is weakening too, and if it should continue, worries over inflation will vanish very quickly. Oil is the key driver to most inflation indexes, and where oil prices go, so too do those indexes."
Contributor Callum Thomas asks, Value Vs Growth Rally Stalls, Where-To Next?
"What an incredible snapback for growth stocks off the March 14 low. To be fair, the SPDR S&P 500 Growth ETF (SPYG) actually hit a nadir just above $58 back on February 24. The ETF managed to successfully test that level twice in March before surging higher. It closed above $68 on March 29.
Value stocks, as measured by the SPDR S&P 500 Value ETF (SPYV), have not recovered nearly as dramatically. But their rebound could be seen as more notable considering SPYV is within 1% of closing at a fresh all-time high and Vanguard Value ETF (VTV) notched fresh all-time highs on March 29 (total return)."

"Value vs growth established a rounded-bottom pattern during the back half of 2021. A breakout took place right around the turn of the year. Steadily rising interest rates and higher commodity prices no doubt favored some of the cyclical sectors. Big cap tech was also sold off heavily to start 2022.
The Nasdaq 100 hit bear market territory off its November peak—important since SPYG is 44% weighted to the Tech sector. By contrast, SPYV is more spread out with its biggest sector weight being Health Care and Financials at 16% each. The pair’s largest single-stock positions perhaps tell the story: Apple makes up 14% of SPYG while Berkshire Hathaway is 3.4% of SPYV. Bottom Line: We remain bullish on value vs growth."
In the "Where To Invest Department" contributor Sweta Killa finds 5 ETFs To Add As Yield Curve Signals Recession. What follows are Killa's abridged comments. See the full article for additional details.
"The war in Ukraine and new coronavirus restrictions in China have raised the risk of a prolonged global supply chain trouble, thereby leading to slower economic growth.
We have profiled the above-mentioned ETFs below:
Utilities Select Sector SPDR (XLU)
While there are several options in the utilities space, the ultra-popular XLU seems a good bet. With AUM of $14.4 billion, Utilities Select Sector SPDR seeks to provide exposure to companies from the electric utility, water utility, multi-utility, independent power and renewable electricity producers, and gas utility industries. It follows the Utilities Select Sector Index, holding 29 stocks in its basket. Electric utilities takes the top spot in terms of sectors at 63.1%, closely followed by multi utilities (29.3%).
Utilities Select Sector SPDR...has a Zacks ETF Rank #3 (Hold) with a Medium risk outlook.
iShares U.S. Healthcare Providers ETF (IHF)
Healthcare, which generally outperforms during periods of low growth and high uncertainty, will see huge investor interest due to its non-cyclical nature...iShares U.S. Healthcare Providers ETF follows the Dow Jones U.S. Select Healthcare Providers Index with exposure to companies that provide health insurance, diagnostics, and specialized treatment.
In total, iShares U.S. Healthcare Providers ETF holds 71 securities in its basket and has amassed $1.3 billion in its asset base...has a Zacks ETF Rank #3 with a Medium risk outlook.
Vanguard Consumer Staples ETF (VDC)
The consumer staples sector is viewed as defensive as it includes a variety of items like food & beverages, non-durable household goods, hypermarkets, and consumer supercenters that are essential for daily needs...Vanguard Consumer Staples ETF targets the broad consumer staples by tracking the MSCI US Investable Market Consumer Staples 25/50 Index. It holds 99 stocks in its basket...it has a Zacks ETF Rank #3 with a Medium risk outlook.
Vanguard Dividend Appreciation ETF (VIG)
Dividend-focused products offer safety in the form of payouts while at the same time providing stability as mature companies are less volatile to large swings in stock prices. This is because the companies that pay dividends generally act as a hedge against economic uncertainty and provide downside protection by offering outsized payouts or sizable yields on a regular basis. Vanguard Dividend Appreciation ETF is the largest and the most popular ETF in the dividend space...The product has a Zacks ETF Rank #1 (Strong Buy) with a Medium risk outlook.
iShares MSCI USA Quality Factor ETF (QUAL)
Quality stocks are rich in value characteristics with a healthy balance sheet, high return on capital, low volatility, elevated margins, and a track record of stable or rising sales and earnings growth. These products...hold up rather well during market swings. iShares MSCI USA Quality Factor ETF provides exposure to large and mid-cap stocks exhibiting positive fundamentals (high return on equity, stable year-over-year earnings growth, and low financial leverage) by tracking the MSCI USA Sector Neutral Quality Index. iSares MSCI USA Quality Factor ETF holds 124 securities in its basket and trade in an average daily volume of 1.7 million shares."
As always, caveat emptor.
Closing out today's round-up is contributor Carsten Brzeski who reports that German Inflation Surges In March.

"Higher energy, commodity, and food prices have pushed German headline inflation to the highest level since 1974. The bad news is that this will not be the end of accelerating inflation. For inflation, the only way is up and double-digit numbers can no longer be excluded...Looking ahead, with the war in Ukraine and continued tension and upward pressure on energy, commodity, and food prices, headline inflation in Germany will accelerate further in the coming months. The pass-through to all kinds of sectors is in full swing. Add to this the additional price mark-ups in the hospitality, culture, and leisure sectors once the current round of restrictions is over and it is hard to see inflation coming down significantly any time soon. Against the backdrop of recent geopolitical events, we now expect German inflation to average at more than 8% this year with a chance that monthly inflation rates will enter the double-digit territory in the summer...there is very little the ECB (European Central Bank) can do to stop the war or to bring down energy prices...It would need a clear end to the war, lifted sanctions combined with stepped-up fiscal stimulus to engage the ECB in a more genuine tightening cycle."

Have a good one.
I'll see you next month.


