
The Commodity Bull Has Begun…
(Click on image to enlarge)
As an alternative approach, one of the traders I know does very well in the stock index markets by trying to figure out how the stock market can hurt the most traders. It seems to work for him. ~ Bruce Kovner
Summary: The primary trend in equities is still up, but some growing divergences raise the specter of a short-term shakeout in the 4-7% range. We have a confirmed breakout in the BBG Commodities Index, Ags starting to come alive, a breakout in the dollar, and a fertilizer play setting up for a move…
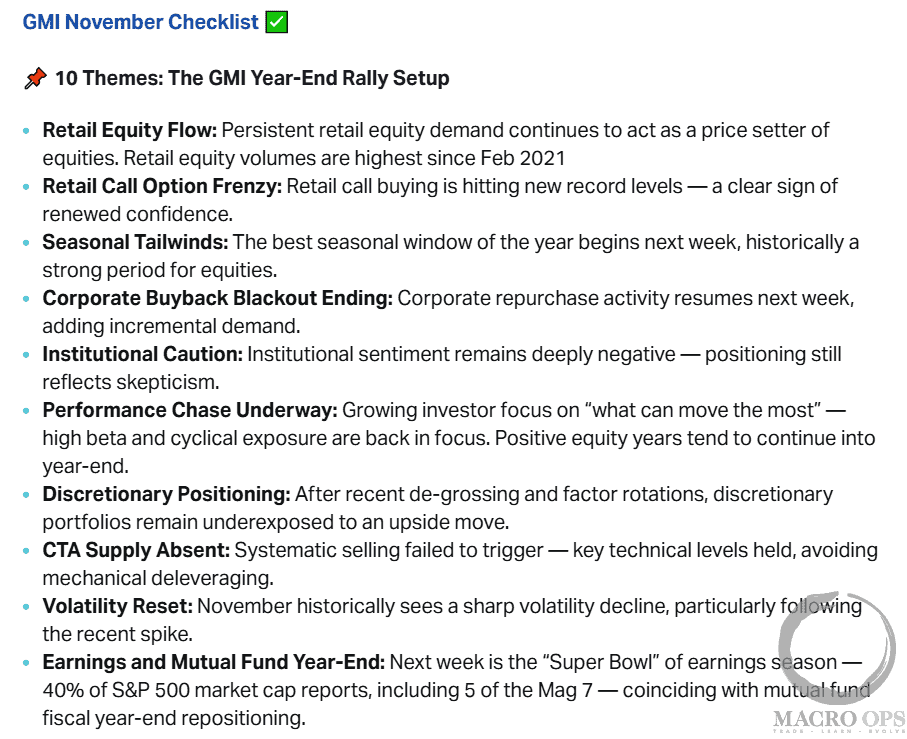
1. Citadel Securities published its updated market outlook last week. Here’s the link and here’s their “10 Themes: The GMI Year-End Rally Setup” list. We agree with the take.
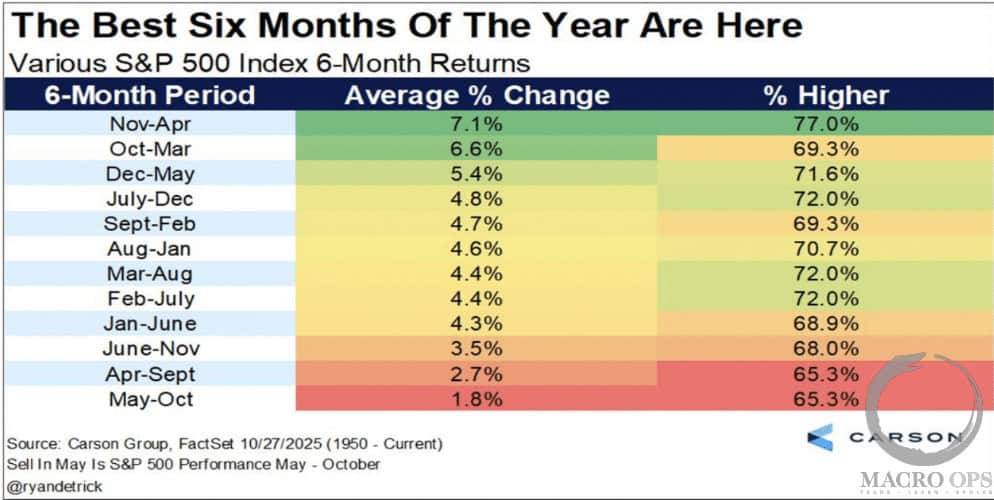
2. We’re also entering the strongest six-month window from a seasonality perspective(chart via @ryandetrick).
(Click on image to enlarge)
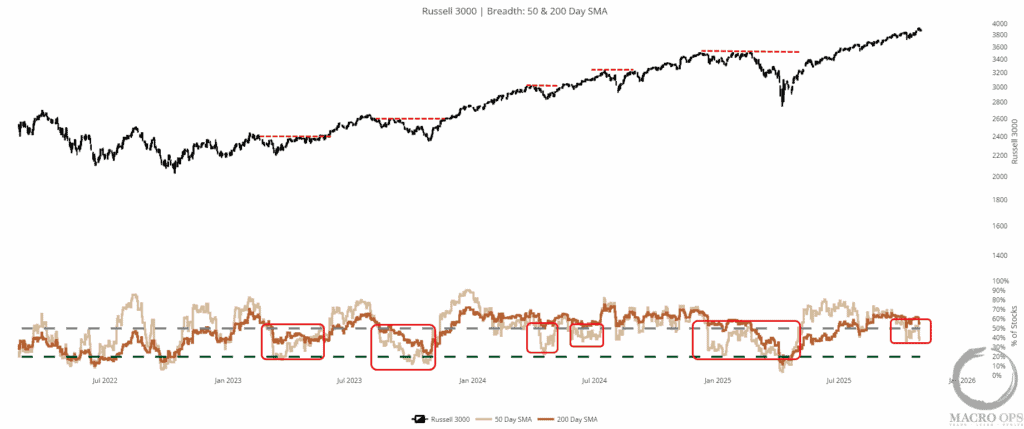
3. We remain bullish on the primary trend in equities and don’t have any interest in fighting this tape. However, we expect increasing chop and vol, and we’re seeing some growing signs of weakness, suggesting the potential for a short-term shakeout—something we’d view as healthy. Example: the % R3K of stocks trading above their 50dma (tan line) is below 50%. This type of weakening breadth typically coincides with / or precedes a corrective period in stocks (red boxes highlight past instances).
(Click on image to enlarge)
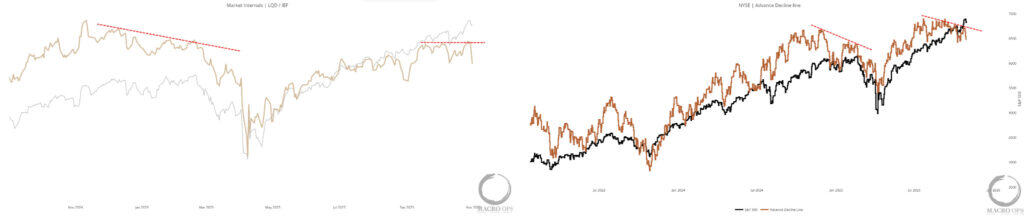
4. We’re also seeing growing negative divergences in LQD/IEF and the NYSE AD-line. The weakness isn’t broad or developed enough to turn outright bearish. But it’s the kind of action that typically precedes more minor pullbacks in the market (ie, -5%).
(Click on image to enlarge)
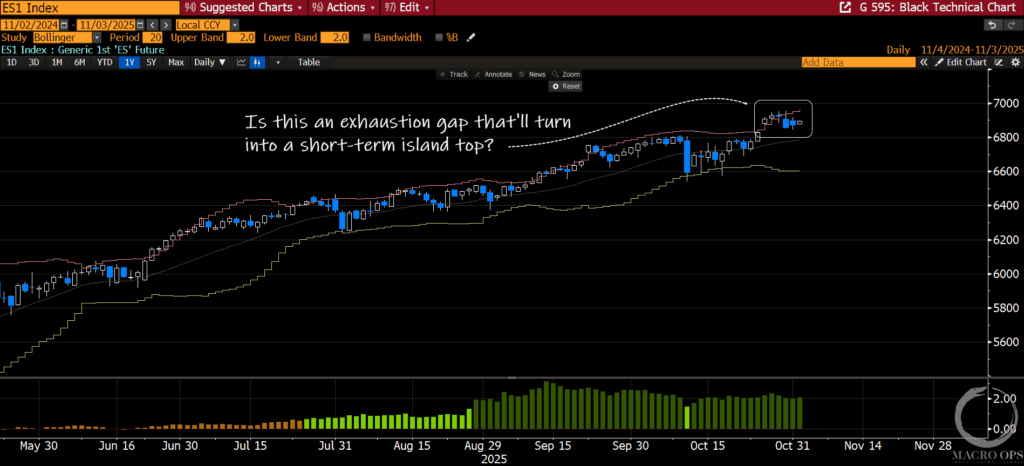
5. Considering the above, I’m looking at last week’s gap up as a potential short-term exhaustion gap that could turn into an island top, should we see the market gap back down.
(Click on image to enlarge)
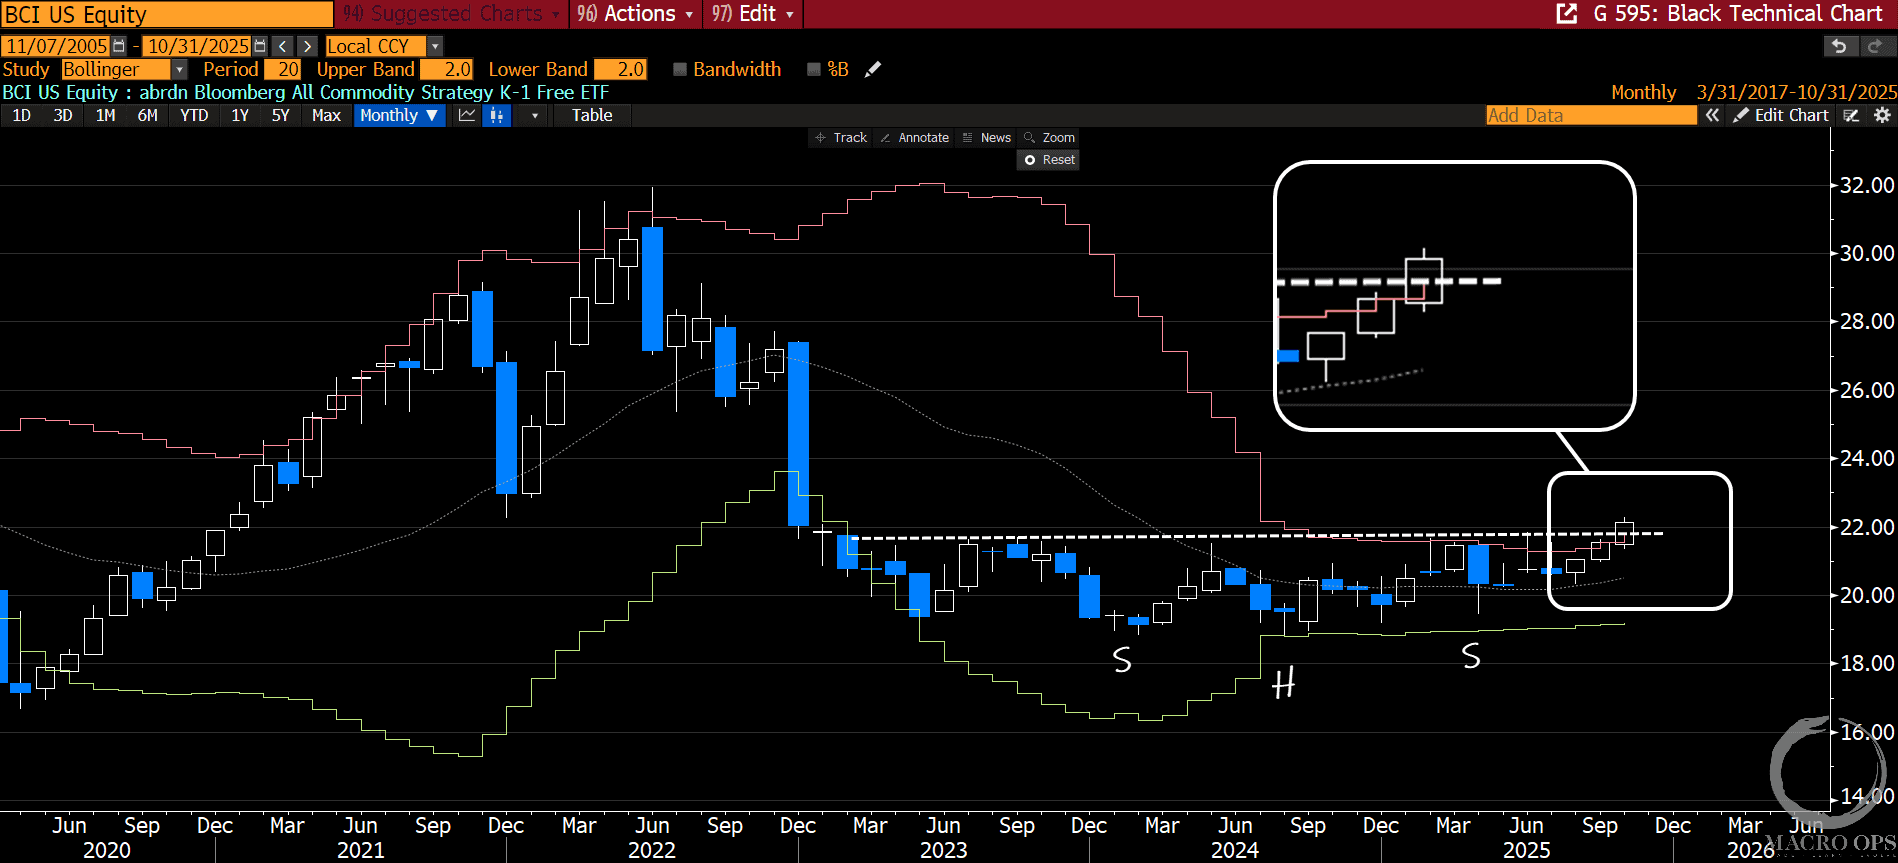
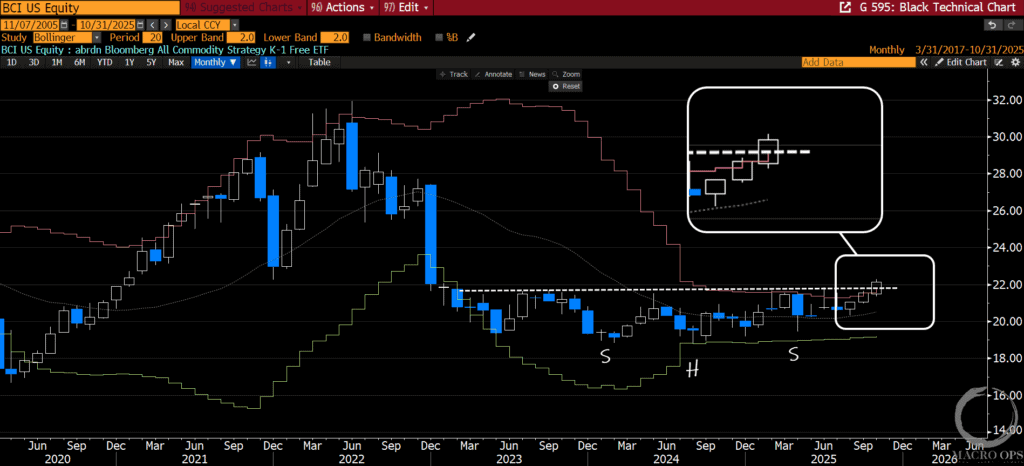
6. We continue to be laser-focused on the commodities space. Bloomberg’s All Commodity Index (BCI) confirmed a breakout on the monthly chart in October. This is a breakout from a massive compression regime and a 3-year inverted H&S bottom. We’ll look to add on a daily close above last week’s high.
(Click on image to enlarge)
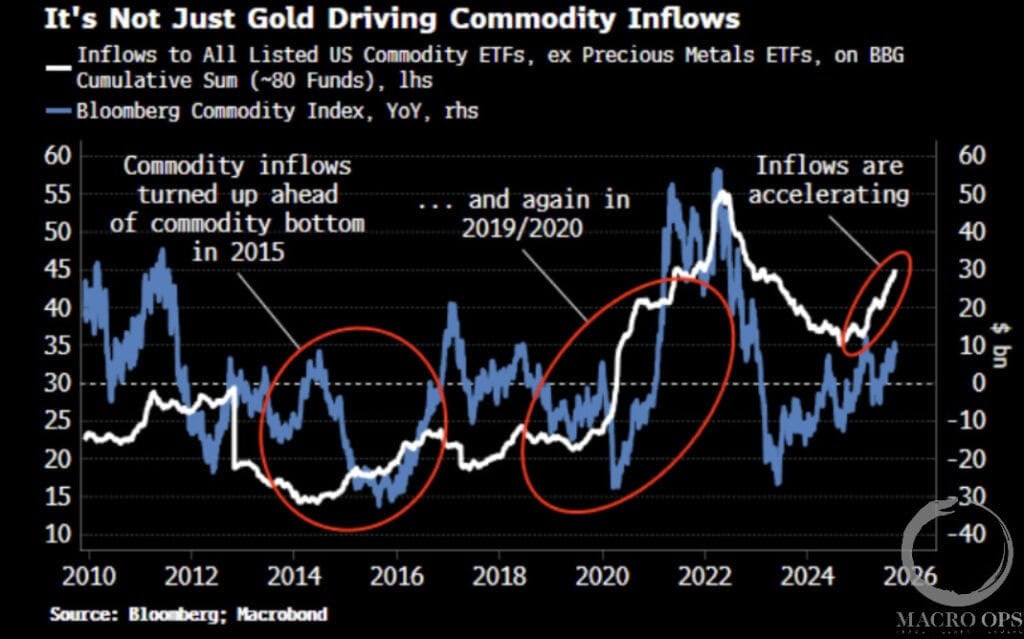
7. I’m re-upping this chart that we shared back in September from BBG’s Simon White. It shows rising cumulative inflows into all listed commodity ETFs, ex precious metals (white line). In the past, similar rising inflows have preceded the last two major bull markets in commodities.
Commodities are about to rip.
(Click on image to enlarge)
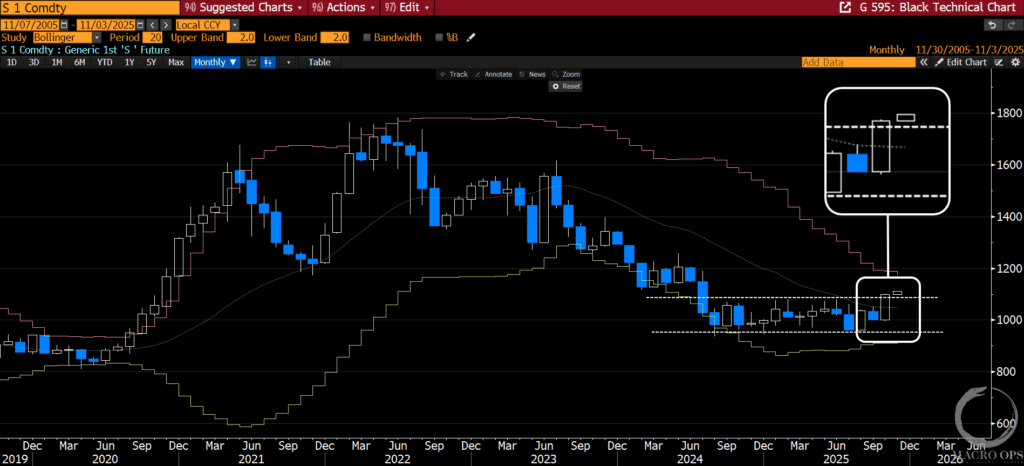
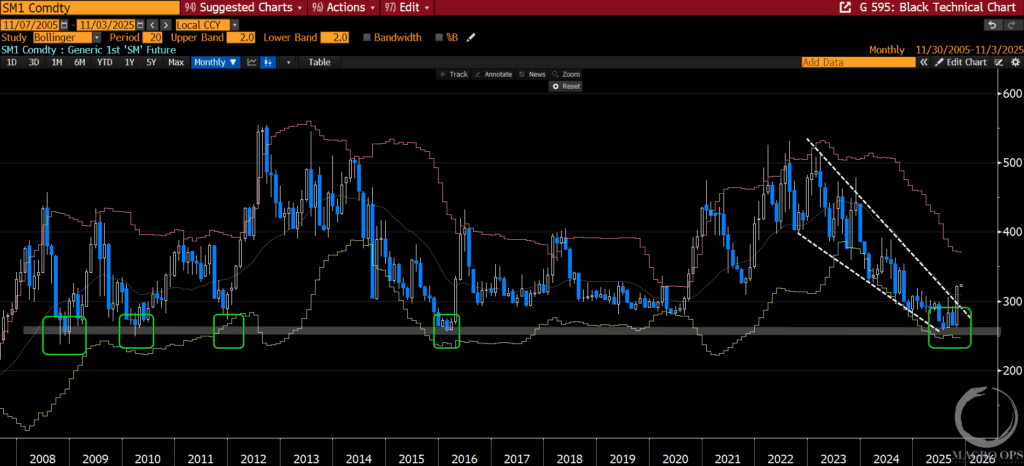
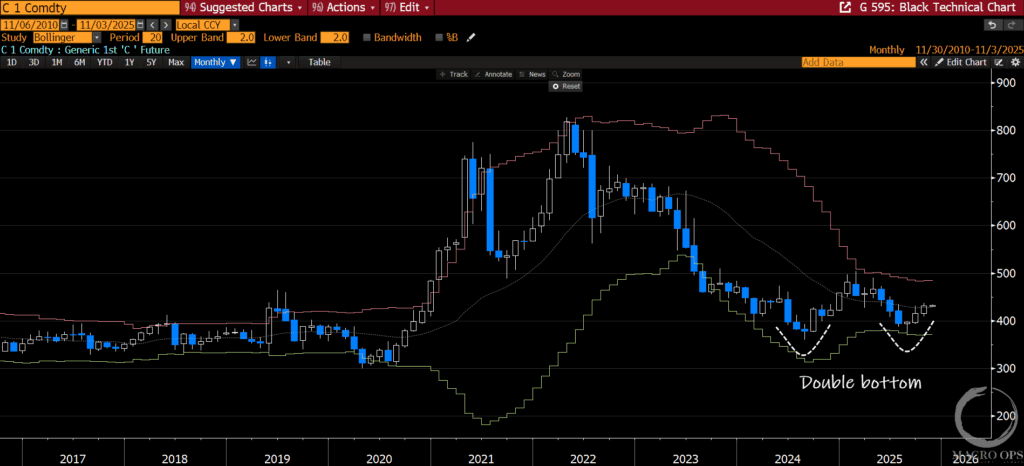
8. In support of this view, we’re starting to see Ags begin to come alive. Below are the monthly charts for Soybeans (which have just broken out of an 18-month+ rectangle), soybean meal (which has just put in a large monthly reversal bar off a 17-year support line), and corn (which has put in a double bottom).
(Click on image to enlarge)
(Click on image to enlarge)
(Click on image to enlarge)
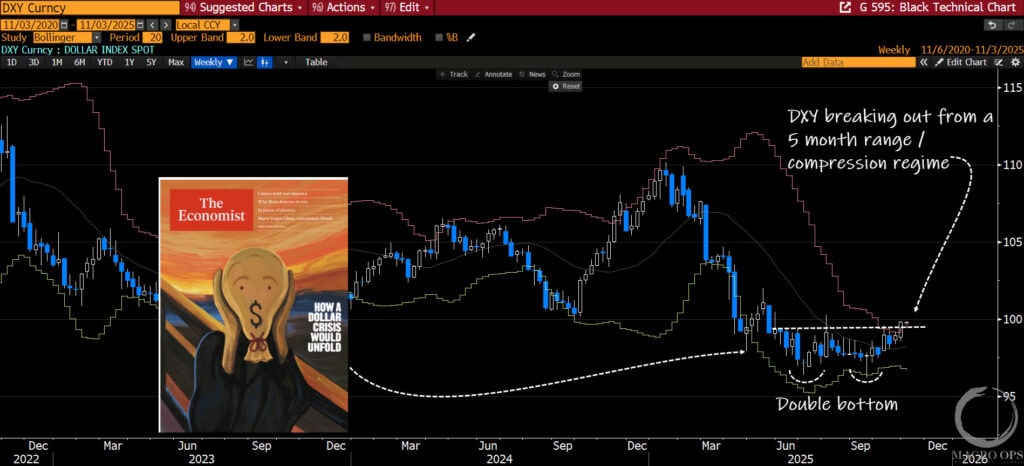
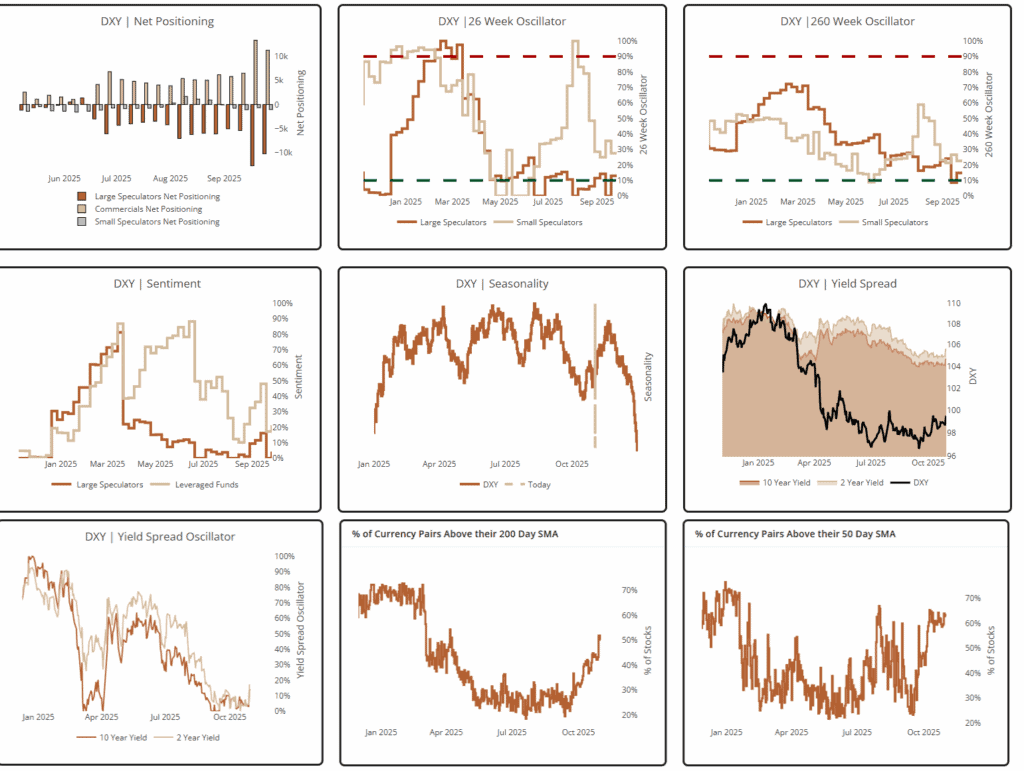
9. The “debasement” narrative had become one of the more consensus narratives over the past year. Yet, the DXY has essentially been rangebound since The Economist’s April cover on “How A Dollar Crisis Would Unfold.” And the DXY just broke out from this range last week.
(Click on image to enlarge)
10. While we haven’t had an update to the CoT data in a month, positioning in the dollar was nearing historic lows, with Large Specs in the 15th percentile on a rolling 3-year basis before the government shutdown. We’re also seeing DXY breadth strengthening while yield momentum is turning up off its lows (bottom three charts).
(Click on image to enlarge)
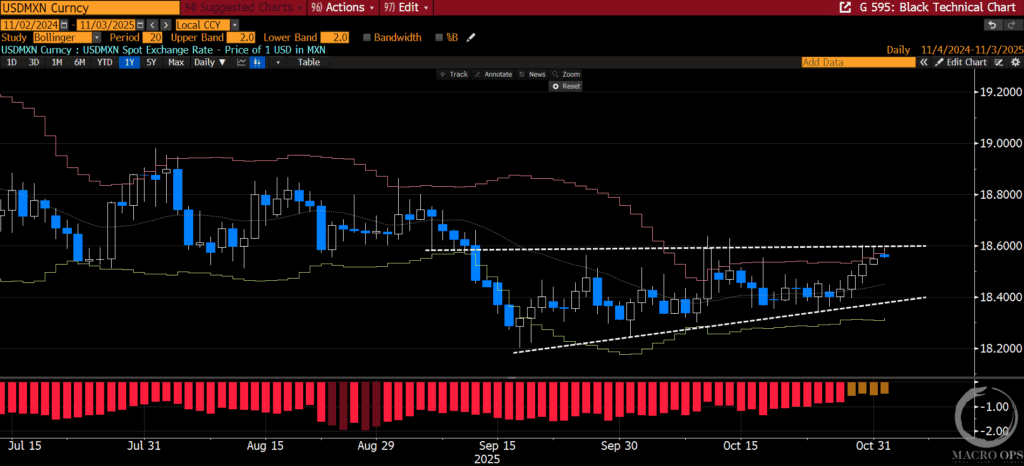
11. Considering the above, a good potential short-term risk-off hedge would be going long USDMXN on a breakout above its current range. The peso had the most crowded positioning as of the last print.
(Click on image to enlarge)
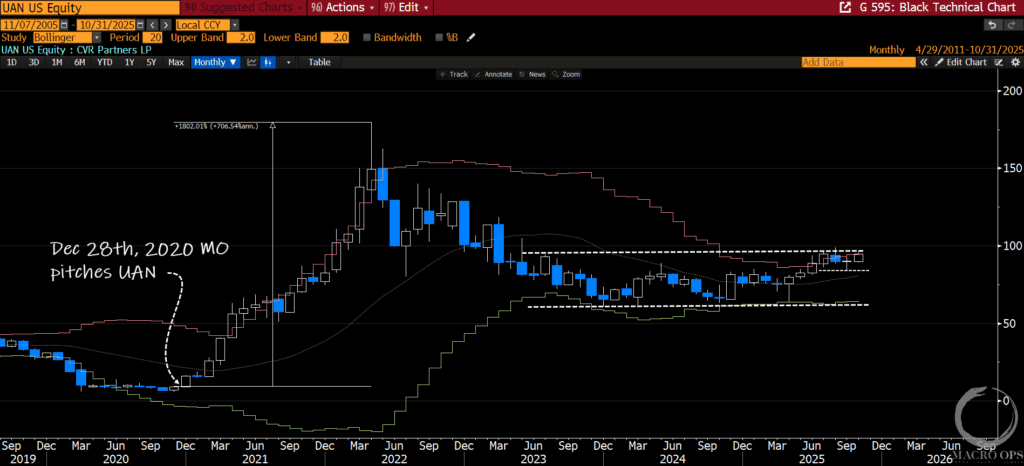
12. One stock we’re considering adding back to our book is CVR Partners (UAN). They’re a US-based producer of nitrogen fertilizer products — a beneficiary of a bull market in soft commodities. We first pitched them back in Dec of 2020, when they were trading for under $15 (link here). We think we could see a similar run over the next 12 months.
(Click on image to enlarge)
More By This Author:
A Big Trade Is Setting Up
A Commodity Boom & Bond Break…
Disregard The Recession Talk…
Disclaimer: All statements are solely opinions and are for educational purposes only.


