
A Big Trade Is Setting Up

Image Source: Pixabay
I want to talk about one of the more exciting and actionable charts in macro right now. It’s setting up for a beast of a trend, and it looks like it’s about to break out of the gate any week now. But before we get to it, I want to first set the backdrop by reiterating my general macro thesis looking out over the next six-12 months.
Let’s start by tackling the big one: labor. The labor market is not as weak as everyone thinks it is. Or rather, we’re nowhere near a recessionary unwind in jobs.
COVID-19 has put an end to the old days of macro when one could look at a line on a chart, such as the LEI or ISM, or the Sahm rule, and say this line is going up/down; therefore, this is likely to happen.
Macro used to be “easier.” I put ‘easier’ in parentheses because it’s obviously never been easy. But easier than the post-2020 COVID-19 world, where previously long-standing, reliable relationships have fallen one after another. And now every data point needs to be tediously investigated and viewed within the broader context of all the wild stuff that is going on, as distortions abound.
The labor market is a prime example. It’s here where context matters more than most. So, let me paint some context for us. Over the past year, we’ve seen two incredible shocks to the economy via the administration’s trade war and immigration policies. We started this year near historic lows in tariffs. Post-Liberation Day, we were back to 100-year Smoot-Hawley highs at an effective rate of +28%.
That shock roiled markets and forced a walk back over the preceding months, bringing the effective rate closer to +19%. If that were not enough, this coincided with the largest reversal of immigration flows in recent US history, with net migration turning negative for the first time in nearly a century.
That’s a lot of stress and strain put on US businesses in a very short period of time. Furthermore, much of the uncertainty remains unresolved. The Supreme Court will review the legality of Trump’s tariffs in November. And, importantly, the trade war continues with new announcements hitting the tape weekly (see the significant announcement from China regarding REEs), shifting the business landscape and making it difficult to plan and invest.
Which is all a bit self-defeating, because when you’re trying to reshore production, providing a sense of clarity and stability is kind of essential to getting businesses to make the moves you need them to make, but I digress.
Compounding these challenges is AI—a once-in-a-generation disruptor that everyone agrees will profoundly transform the economy and our very notions of labor. Yet, the exact shape and timeline of that upheaval remain shrouded in uncertainty.
Considering the above, it should come as no surprise that the labor market has been weak. Of course, businesses have slowed hiring. What’s more surprising is how resilient the labor market and the broader economy have been, despite all of the above. That in itself is telling.
The legendary early-20th-century investor Bernard Baruch famously quipped that “something everyone knows isn’t worth a thing”—a reminder that common wisdom gets baked into prices overnight. In today’s post-COVID landscape, with the labor market’s frailty as public as ever, it’s tempting to glance at the soft data and declare, “Labor’s cooling; recession inbound.”
But that’s lazy analysis. We must dig deeper, probing questions like: “In this fractured environment, what distortions might be warping the labor figures?”
The answer? An unequivocal yes.
The immigration crackdown has unleashed one of the most profound supply-side shocks in modern memory. Migrants are twice as prone to juggling multiple jobs compared to native-born workers, and studies indicate that each deportation ripples out to erase about 1.5 times as many positions overall—hitting both immigrants and U.S.-born alike. That’s the root of the yawning gap in the data: prime-age employment holding firm, while headline payrolls falter.
This year’s massive net exodus of immigrants has slashed the monthly job-creation threshold needed to stabilize the labor force—down to well under 50,000, and potentially as low as 10,000—casting the latest softness in an entirely new hue.
And AI’s nascent labor tremors? They’re already rippling through the youngest ranks—the 16-to-24 cohort—where employment has plummeted the most over the past year, as automating entry-level routines proves the ripest target.
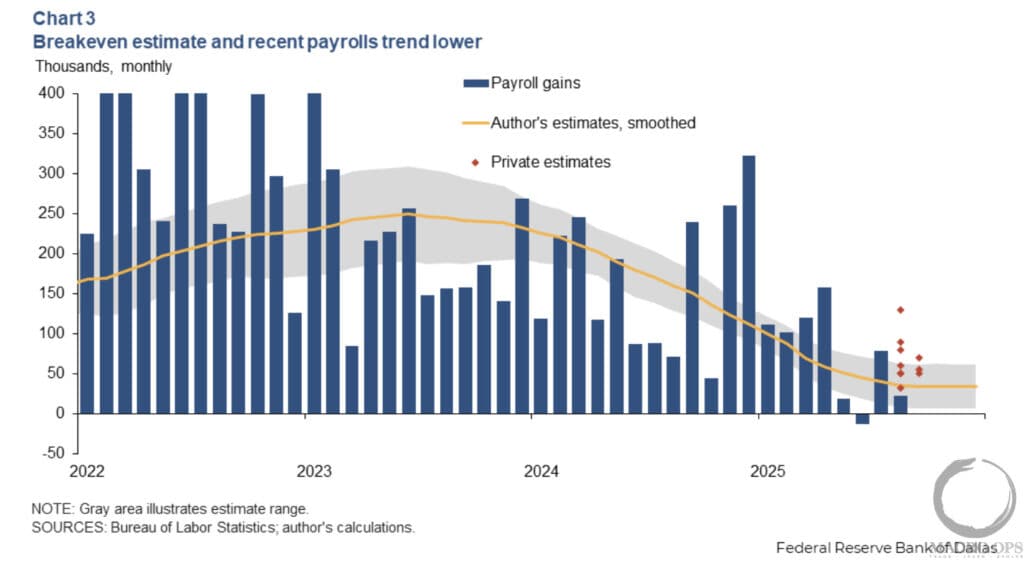
As I write this, I see that the Dallas Fed recently published research on this, finding:
A new, high-frequency estimate of break-even employment shows a dramatic reversal in immigration flows, combined with cyclical shifts in labor force participation, has caused the monthly break-even requirement to collapse from a peak of approximately 250,000 in 2023 to about 30,000 in mid-2025.
This recalibration suggests that today’s more modest payroll gains don’t signal weakness but are consistent with a balanced labor market. Furthermore, the new measure highlights the growing importance of using timely, comprehensive data to track an economy reshaped by volatile demographic forces.
(Click on image to enlarge)
Additionally, where we are now is less important than where we expect things to be in 12 months. And on the labor side of things, we expect the picture to improve.
First, the Supreme Court’s decision, whatever it is, should bring some clarity. Resolving this matter will alleviate uncertainty and enable companies to resume effective planning and investment in their businesses. With this should come an unfreezing of the labor market, breaking the “no hire, no fire” regime we’ve been in all year.
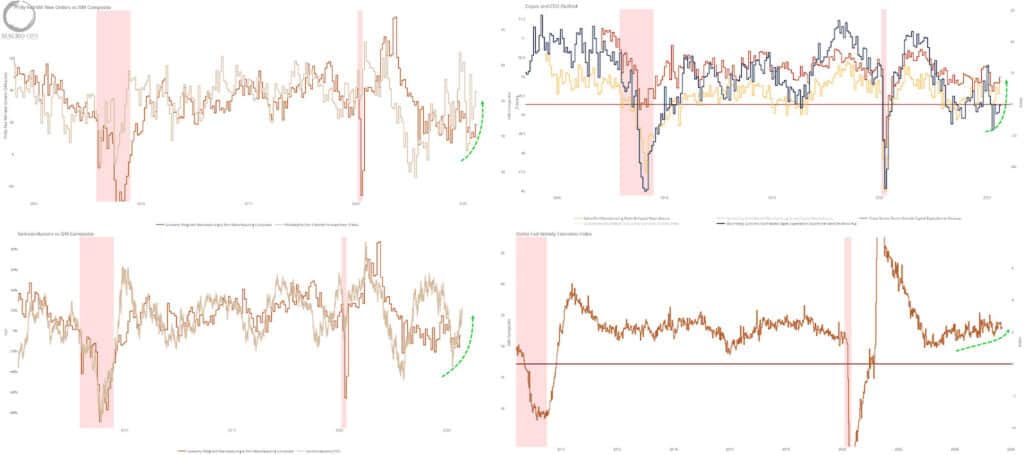
Secondly, we’re already seeing indications that this is beginning to happen, with a number of our growth leads and CAPEX leads putting in a sharp U-turn higher over the past few months after their post-Liberation day nosedive.
(Click on image to enlarge)
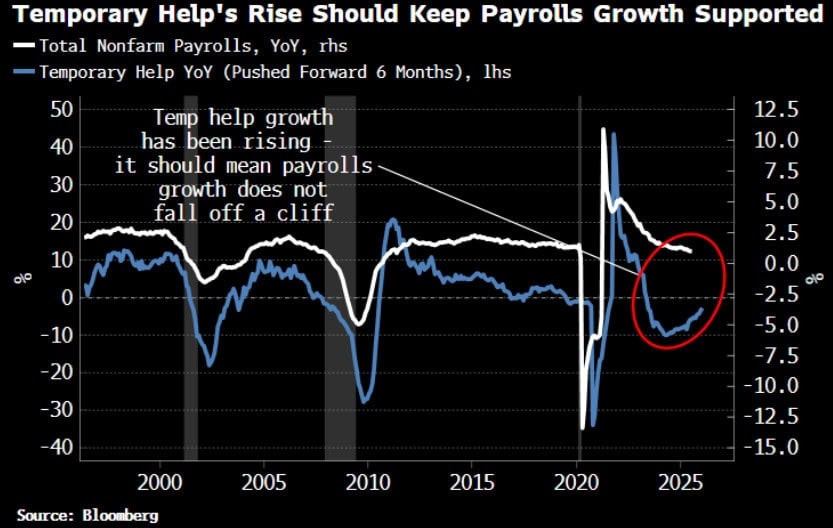
We’re also seeing this confirmed in Temporary Help year-over-year, which is one of the better direct leads of the labor market. This data bottomed in late 2024 and has been recovering over the past six months (chart via BBG’s Simon White).
(Click on image to enlarge)
Lastly, there are a number of other significant macro tailwinds that are coming into effect now and over the next six months. A few of the more important ones are as follows.
Fed’s Supplementary Leverage Ratio (SLR) Changes
- The Fed’s proposed SLR relief will reduce capital requirements for the largest banks, unlocking over $200 billion in lending capacity—comparable to two months of peak COVID-era QE.
- This unleashes a powerful surge in private credit creation and liquidity outside the central bank balance sheet, improving system-wide liquidity and supporting risk assets.
- Contrary to some narratives, banks are unlikely to load up on long-duration Treasuries; instead, increased liquidity favors duration and risk asset rallies but puts downward pressure on the US dollar.
- This shift marks a transition from monetary dominance (Fed balance sheet expansion) to fiscal and private credit dominance in liquidity provision globally.
US Fiscal Impulse
- Come Jan. 1, there will no longer be taxes on tips. This will increase disposable income for service workers to the effect of $100 billion in 2026 alone.
- Trump is openly discussing distributing tariff revenues back to households in the form of direct $600-$2,000 checks, echoing fiscal stimulus seen in 2020-2021.
- There is potential for an announcement around a “Housing Emergency” relief fund going into year-end.
Global Fiscal Arms Race
- China is ramping fiscal stimulus with a planned ~4% GDP deficit and renewed credit issuance aimed at tech, consumption, and infrastructure, albeit with controlled real estate exposure.
- Japan: Newly elected PM Takaichi committed to “legislation to reduce gasoline taxes and create a supplementary budget”—“Fiscal expansion will be unavoidable…with aid to households and investment to boost productivity, I’d like to shift Japan’s state of inflation into a moderate one driven by wage growth.” “Japan needs high-pressure economy, 5% nominal growth, and robust stimulus” is the official line.
- The EU pursues a multi-year EUR800 billion defense and infrastructure spending plan focused on drone defense and digital sovereignty, expected to boost growth and equities in 2026-2029
Bottom line: A recession is a tall order when fiscal deficits are ballooning (as they are), household and private-sector balance sheets remain rock-solid (as they do), and the world’s major economies are locked in a relentless fiscal arms race.
With that settled—the labor market exposed as a warped laggard, not some prescient canary, and growth poised to rev up anew—what’s the trade?
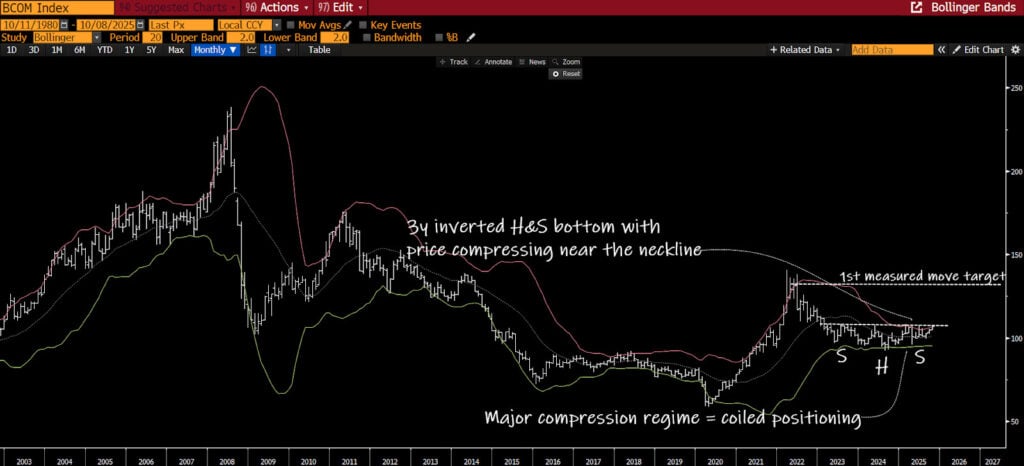
Commodities. Below is a monthly chart of the Bloomberg Commodity Index. I’ve been harping on this one for months now, noting the major compression regime and long-term head-and-shoulder base.
(Click on image to enlarge)
Remember, compression regimes precede expansionary regimes (i.e., big trends). Examples: 2014 compression in WTI crude, BTC/USD compression in 2023 and 2024, gold compression from 2021 to 2024 and 2016 to 2019, DXY in 2013-14, etc. Below are monthly charts with Bollinger Bands and BandWidth indicators.
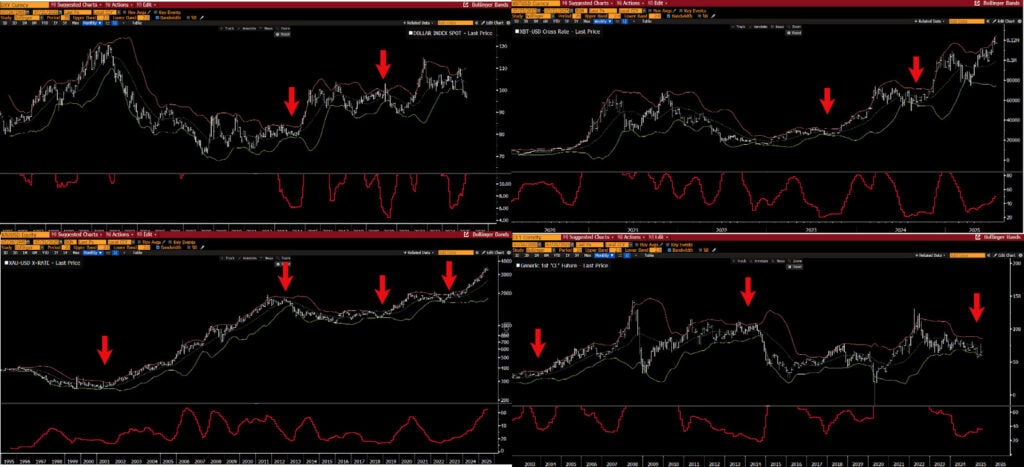
(Click on image to enlarge)
And while compression setups are directionally agnostic, all the evidence (as outlined above) suggests that the upcoming breakout will be bullish.
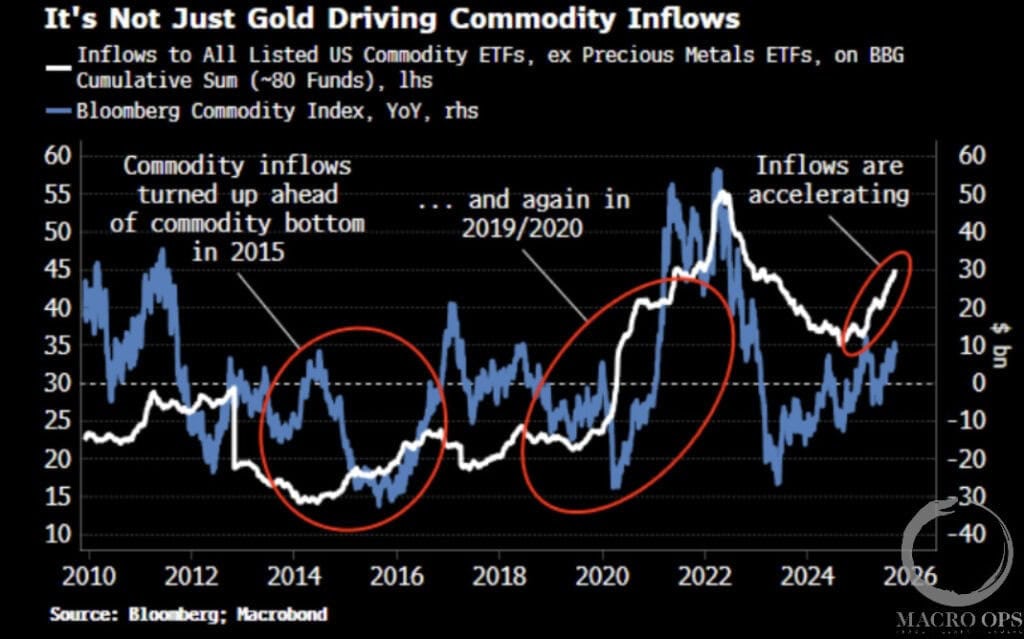
BBG’s Simon White shared this great chart a few weeks ago showing rising cumulative inflows into all listed commodity ETFs, ex precious metals (white line). He points out that similar rising inflows have preceded the last two major bull markets in commodities.
(Click on image to enlarge)
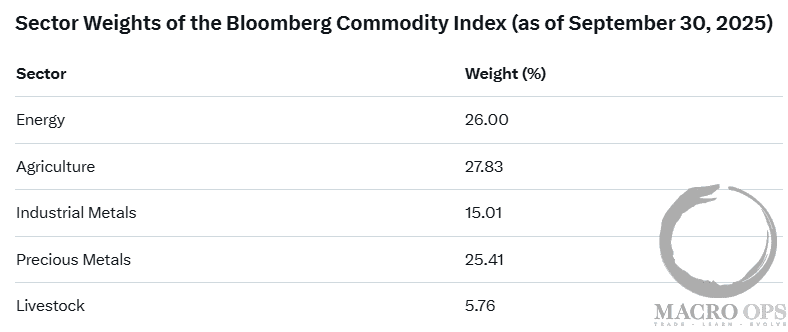
You can find the index's weightings below.
(Click on image to enlarge)
We’ve been heavily long precious metals for the past few years, though we’re now dramatically lightening the book on that front as we think the 4,000 level in gold acts as a ceiling for a while, being that we’re due for a period of consolidation.
But, importantly, we don’t think the precious metals cyclical bull is anywhere close to over. We’re just looking for a healthy correction to play out into the end of the year. The rest of the list we’re increasingly bullish on and believe we’re about to see a change in the economic narrative, and that’s going to show up with increasing inflows into the commodity space.
There are several ways to approach this. If you’re a fund, you can trade the BCI futures, but for most, the best vehicle is going to be iShares S&P GSCI Commodity Indexed Trust (GSG) or Invesco Optimum Yield Diversified Commodity Strategy ETF (PDBC), which, unlike GSG, is K-1 free.
We’re going to start building a long position now, but we’ll be waiting for confirmation via a breakout above the neckline and out of the compression zone before we start to really press our bet. Until then, stay frosty and keep your head on a swivel.
More By This Author:
A Commodity Boom & Bond Break…Disregard The Recession Talk…
My Precious… Metals
Disclaimer: All statements are solely opinions and are for educational purposes only.


