
A Commodity Boom & Bond Break…
“At any moment of time, there are myriads of feedback loops at work, some of which are positive, others negative. They interact with each other, producing the irregular price patterns that prevail most of the time; but on the rare occasions that bubbles develop to their full potential, they tend to overshadow all other influences..” ~ George Soros
Summary: This is still a market you want to be long and buying. Sure, things are a bit overextended over the short term, and we could see a pullback soon. But we expect any pullback to be mild and an opportunity to add risk. Positioning and sentiment largely remain offsides (w/ CTAs & Vol control the sole exception), and there’s still lots of room for both to drive risk assets higher. Bonds and commodities remain in major compression regimes, suggesting BIG trends are coming. Our growth leads tell us reflation, not stagflation, is on the way. And we’re seeing a short setup in Euribors and a long play in PGMs….
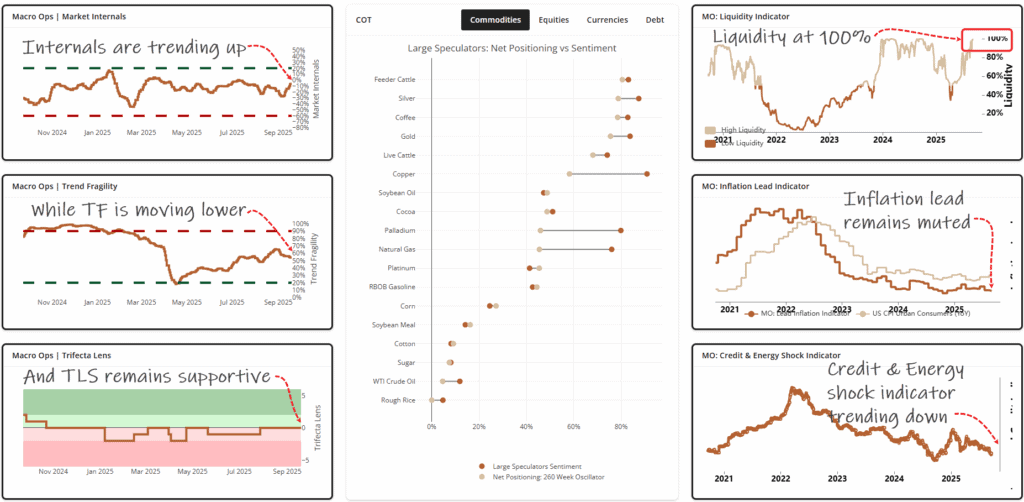
1. We’ve been consistently pointing out the bullish tailwinds for stocks since mid/late April, when we first started adding back risk to our book. These tailwinds remain: market internals trending up (SMH/SPY & QQQ/SPY both regained leadership last week), trend fragility neutral and trending lower, TLS composite confirming bull trend, inflation lead stable, and our liquidity indicator just maxed out at 100%.
(Click on image to enlarge)
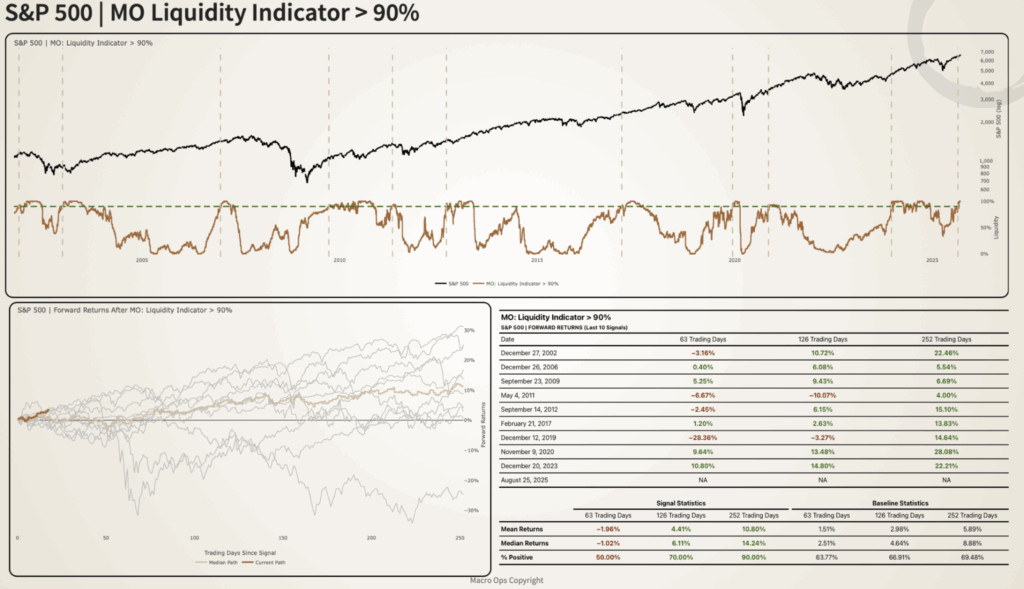
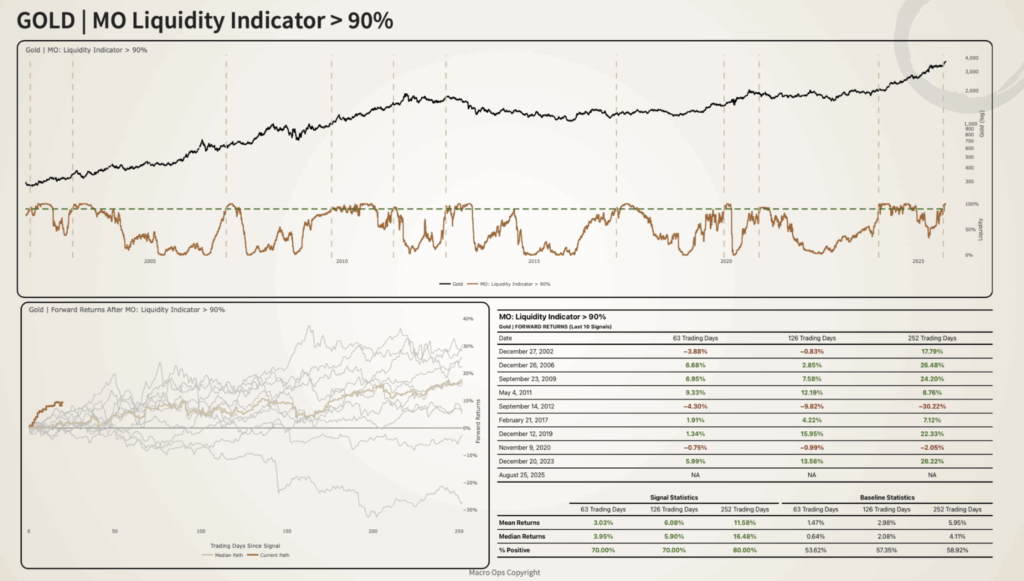
2. Below are the forward returns following a liquidity reading of 90%+. Gold was higher 80% of the time over the following 12 months, with average gains of 16%. And the SPX was higher 90% of the time, with average gains of 14%.
(Click on image to enlarge)
(Click on image to enlarge)
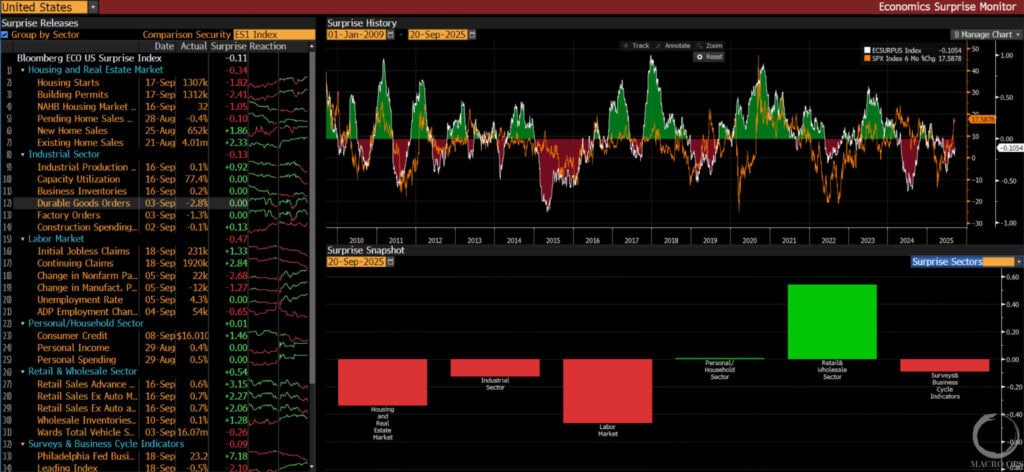
3. BBG’s Economic Surprise Index has been negative for much of the year, meaning economic expectations were too optimistic relative to actual data prints. We can see that the most significant disappointments have been in the housing and labor markets. Surprise indices like the one below are a good illustration of the Narrative Pendulum at work, as sentiment and expectations tend to swing back and forth, lagging reality.
All our indicators tell us to expect positive growth surprises over the coming months.
(Click on image to enlarge)
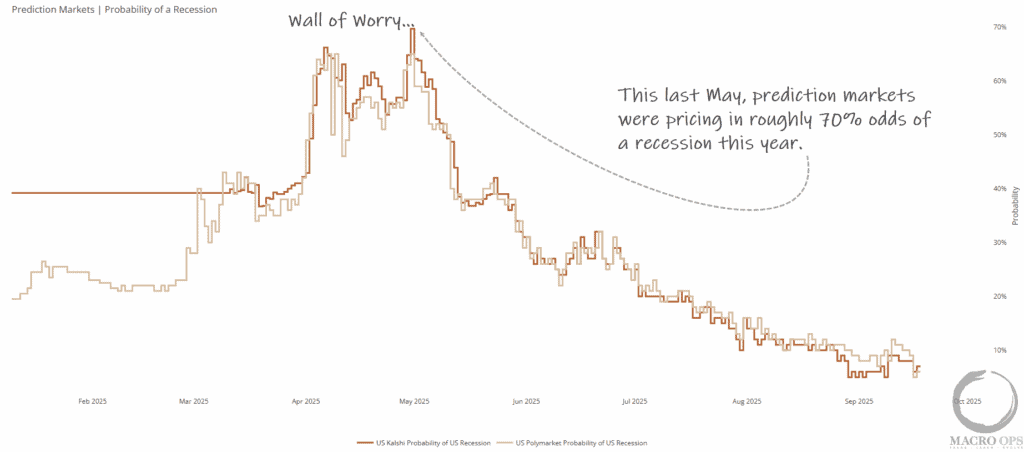
4. This lag is what creates the Wall of Worry that risk assets climb. Below is an example. In May, prediction markets were pricing in a near 70% chance of recession. This provided ample fuel for stocks to climb higher.
(Click on image to enlarge)
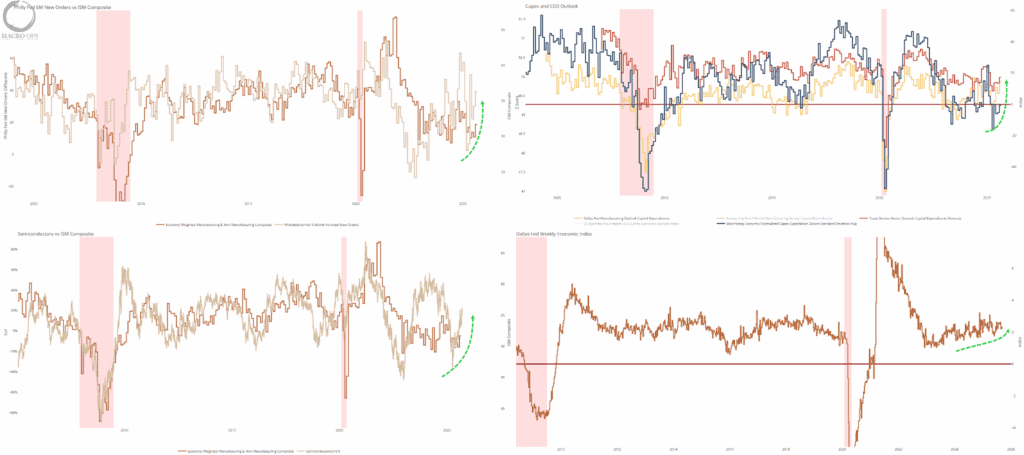
5. Stagflation has been the consensus call for the past six months. But we find ourselves firmly in the reflation camp, with a number of leads clearly pointing to an acceleration in growth going into the end of the year.
(Click on image to enlarge)
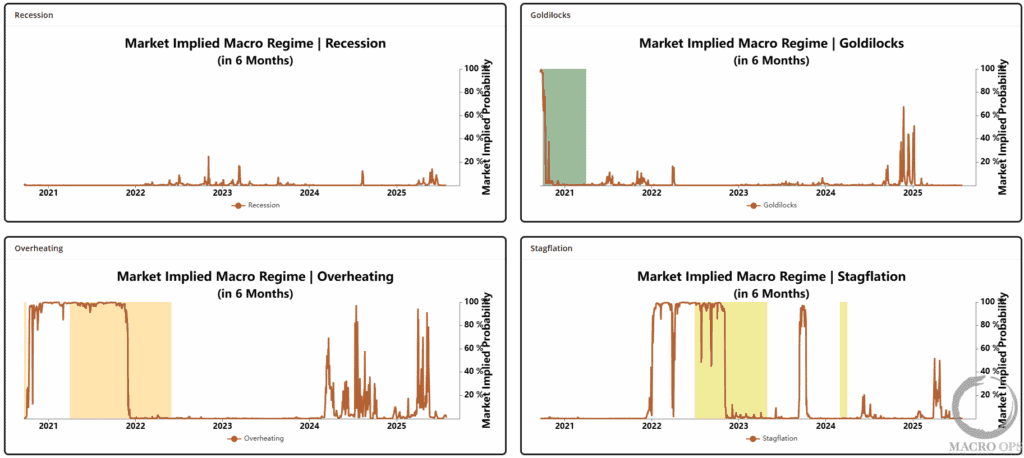
6. Our Market Implied Macro Regime indicator isn’t currently pricing in significant odds for a specific regime. But I suspect we’ll see the probability of an “Overheating” regime rise over the coming months.
(Click on image to enlarge)
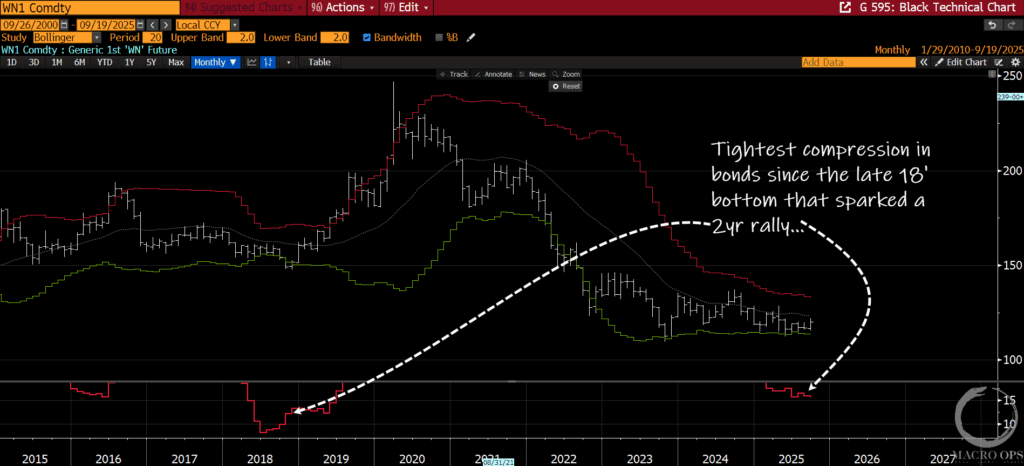
7. I know I’ve already pointed out the large compression regimes in bonds and commodities several times over the past two months. But when I see markets go quiet like this and start to squeeze, I become a bit of a bloodhound as I know a BIG move is coming.
This is a monthly chart of ultras. They’re consolidating near the lower band. My bias is for a breakout to the downside. The macro drivers are in place for a complete unraveling of the long end of the curve. Pay attention to this market.
(Click on image to enlarge)
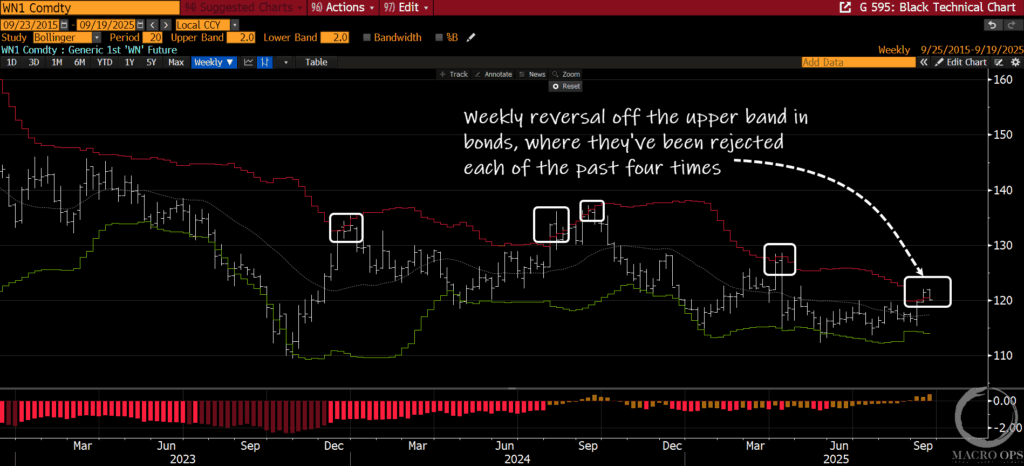
8. We have a decent short entry here with a weekly reversal off its upper weekly Bollinger Band. A spot that has rejected price four other times over the past year.
(Click on image to enlarge)
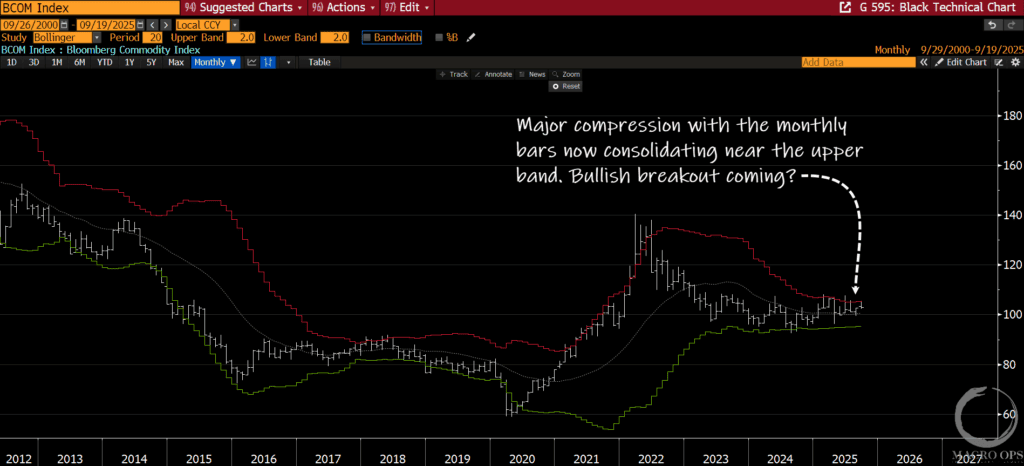
9. And here’s the monthly BBG Commodities Index, which is almost an inverse of bonds. It’s in an uptrend and price is consolidating near the upper band. Again, compression regimes are directionally agnostic and we’ll gladly play a breakout in either direction. But my bias here is for commodities to rip higher and the long end to unravel.
(Click on image to enlarge)
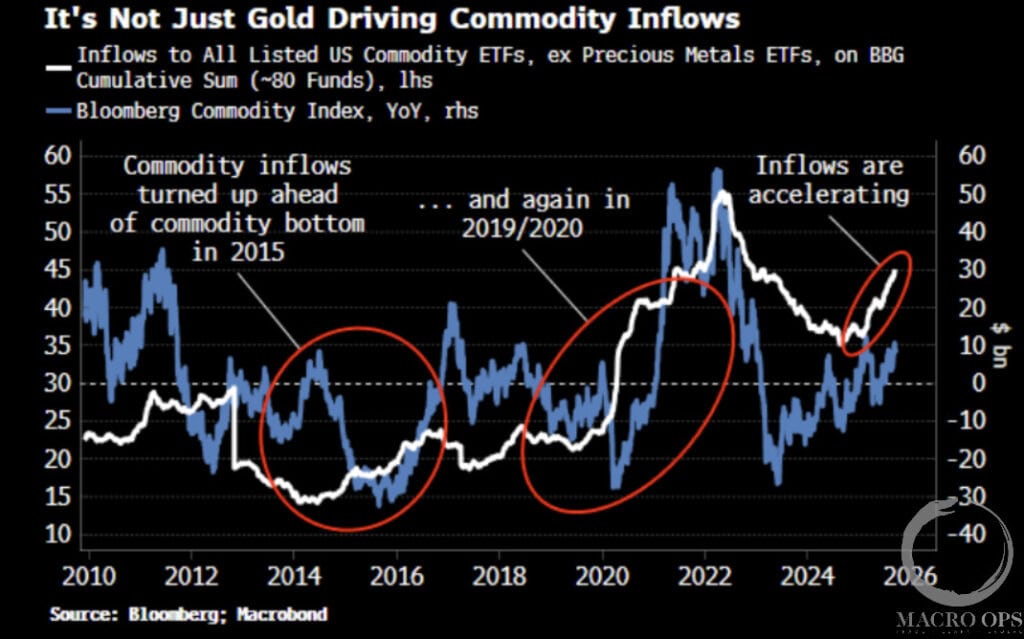
10. BBG’s Simon White posted this great chart showing rising cumulative inflows into all listed commodity ETFs, ex precious metals (white line). He points out that similar rising inflows have preceded the last two major bull markets in commodities.
(Click on image to enlarge)
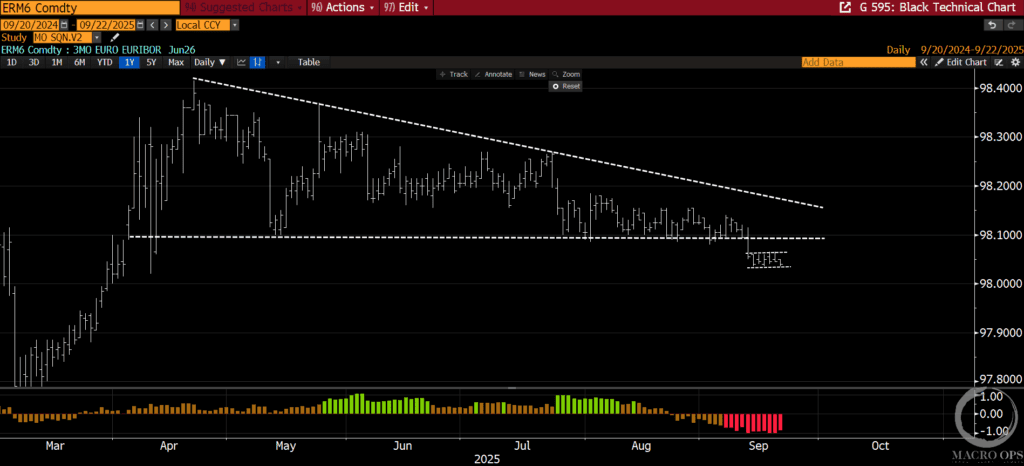
11. We alerted a short 3m Euribor Dec 25’ trade back in July, which continues to play out nicely. We’re getting a similar setup in the June 26’ contract with a tight consolidation below a compression breakout. We’ll consider going short on a break below this range.
(Click on image to enlarge)
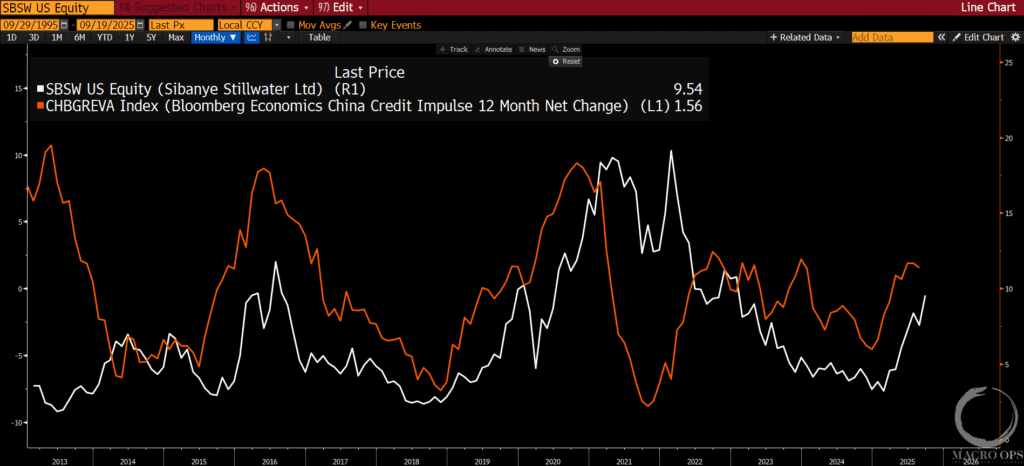
12. We’ve been big PGM bulls for the past year.. You can read some of my partner Brandon’s write-ups on the space here and here. Think of PGMs as canaries in the coal mine, as they tend to be really good at sniffing out liquidity, which is why there’s such a strong correlation between China’s YoY Credit Impulse (orange line) and Sibanye Stillwater in white, below.
SBSW completed an inverted H&S continuation pattern last week, providing a good opportunity to get long.
(Click on image to enlarge)
More By This Author:
Disregard The Recession Talk…
My Precious… Metals
Big Moves Are Coming To Key Markets…
Disclaimer: All statements are solely opinions and are for educational purposes only.


