
Big Moves Are Coming To Key Markets…
This week, I’m covering the major compression regimes and big trend potential setups that I’m seeing across key macro assets. I then update our key HUD indicators for the week (hint: we’re still securely in a risk-on and buy-the-dip regime). And finally, end with the actionable setups I’m tracking for the week.
YTD Portfolio Performance: +30.6% ytd
Current Positioning / Open Orders:
- Futures: Long S&P 500, Nasdaq 100, Gold, Silver & short Japanese Yen, Russell 2K
- FX: Long USDSEK
- Equities:
- Long Defense & Aerospace
- Long Metals & Mining
- Long Energy
- Crypto:
- Long BTCUSD
- Long SOLUSD
- Long SUIUSD
These markets are full of major compression regimes across key macro assets.
For those of you unfamiliar with what a compression regime or squeeze is, here’s a short refresh:
Compression regimes refer to periods of extreme low volatility and narrow price movement where markets appear stalled and trade sideways, often following strong directional trends. John Bollinger of Bollinger Band fame would call these technical patterns “squeezes”.
These phases matter because they frequently precede major breakouts — compression regimes lead to expansionary regimes (ie, BIG trends). And it’s often the case that the longer and tighter the compression regime, the larger and longer the following trend is.
These regimes are the technical reflection of two opposing narratives, between bulls and bears. But due to a lack of catalyst, neither side is aggressively pushing their hand. Active traders leave the market due to a lack of trend, and patient hands very slowly build up their positions.
This creates a budding tension which forms the underlying positioning pressure that then creates the subsequent trend. Think of a rubber band that’s been coiled tight. A compression zone is similar in that the longer and tighter it is, the more extreme the built-up kinetic energy that is released upon a breakout.
Once a catalyst hits, that’s enough to shift supply/demand out of balance. Active traders come back into the market on a breakout, while patient hands on the right side of the trend build their positions. Those caught wrong-footed are forced to cover, providing additional demand.
And as a result, a large enduring trend is born.
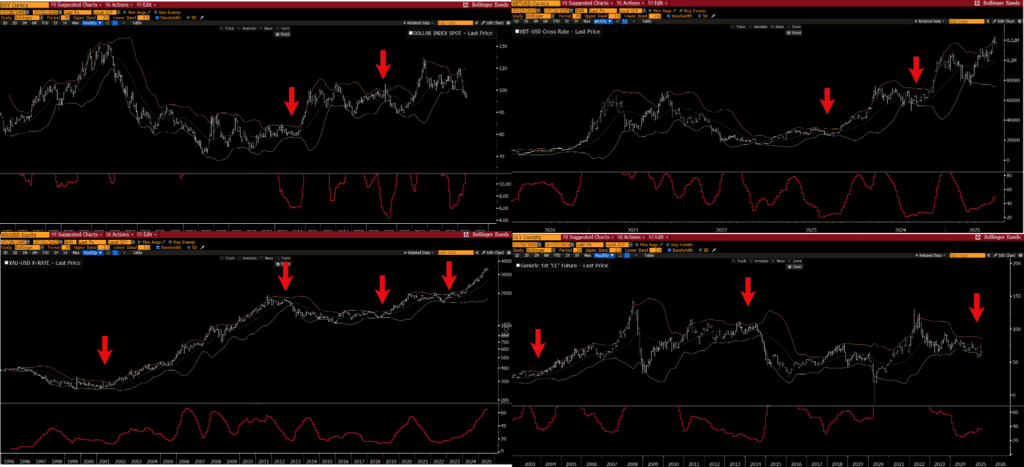
Examples: 2014 compression in WTI crude, BTCUSD compression in 23’ and 24’, gold compression from 21’ to 24’ and 16’ to 19’, DXY in 13’-14’, etc… Below are monthly charts with Bollinger Bands and BandWidth indicators.
(Click on image to enlarge)
Now that we’re all caught up, let’s run through some of the compression regimes we’re tracking.
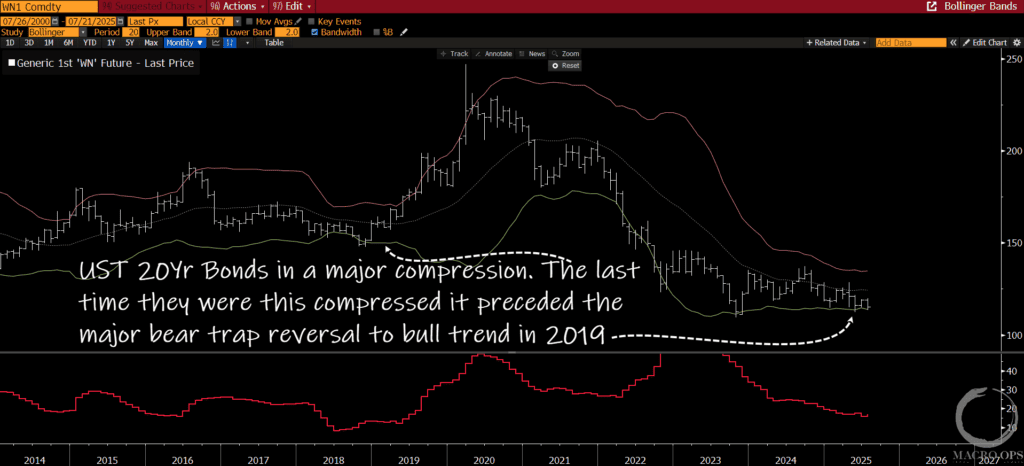
The first is bonds. Below is a monthly chart of the 20yr. This is the most important chart in macro right now.
Bonds are in a 2yr+ sideways compression regime. And the last time they were this squeezed was in 19’, which preceded the major bear trap to multi-year bull run.
(Click on image to enlarge)
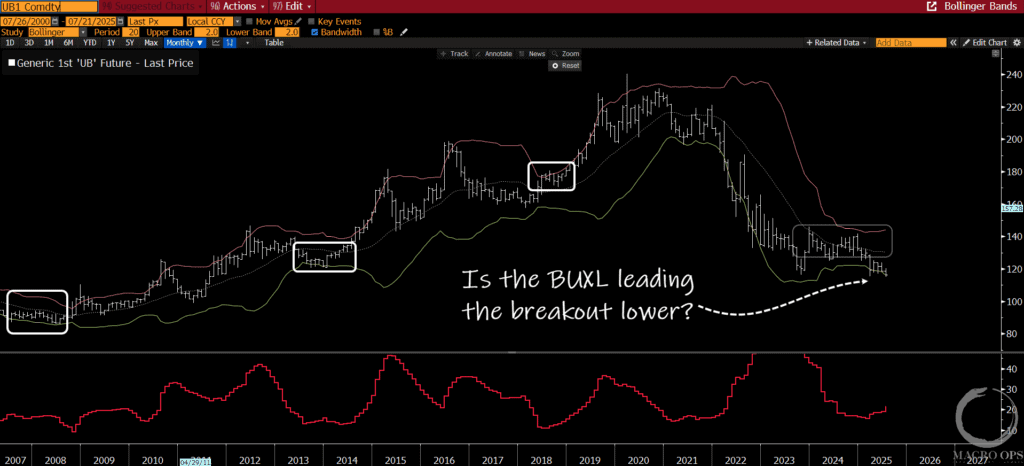
The German BUXL looks to be breaking down from its 2yr+ compression regime (chart is a monthly).
Will we see USTs soon follow?
(Click on image to enlarge)
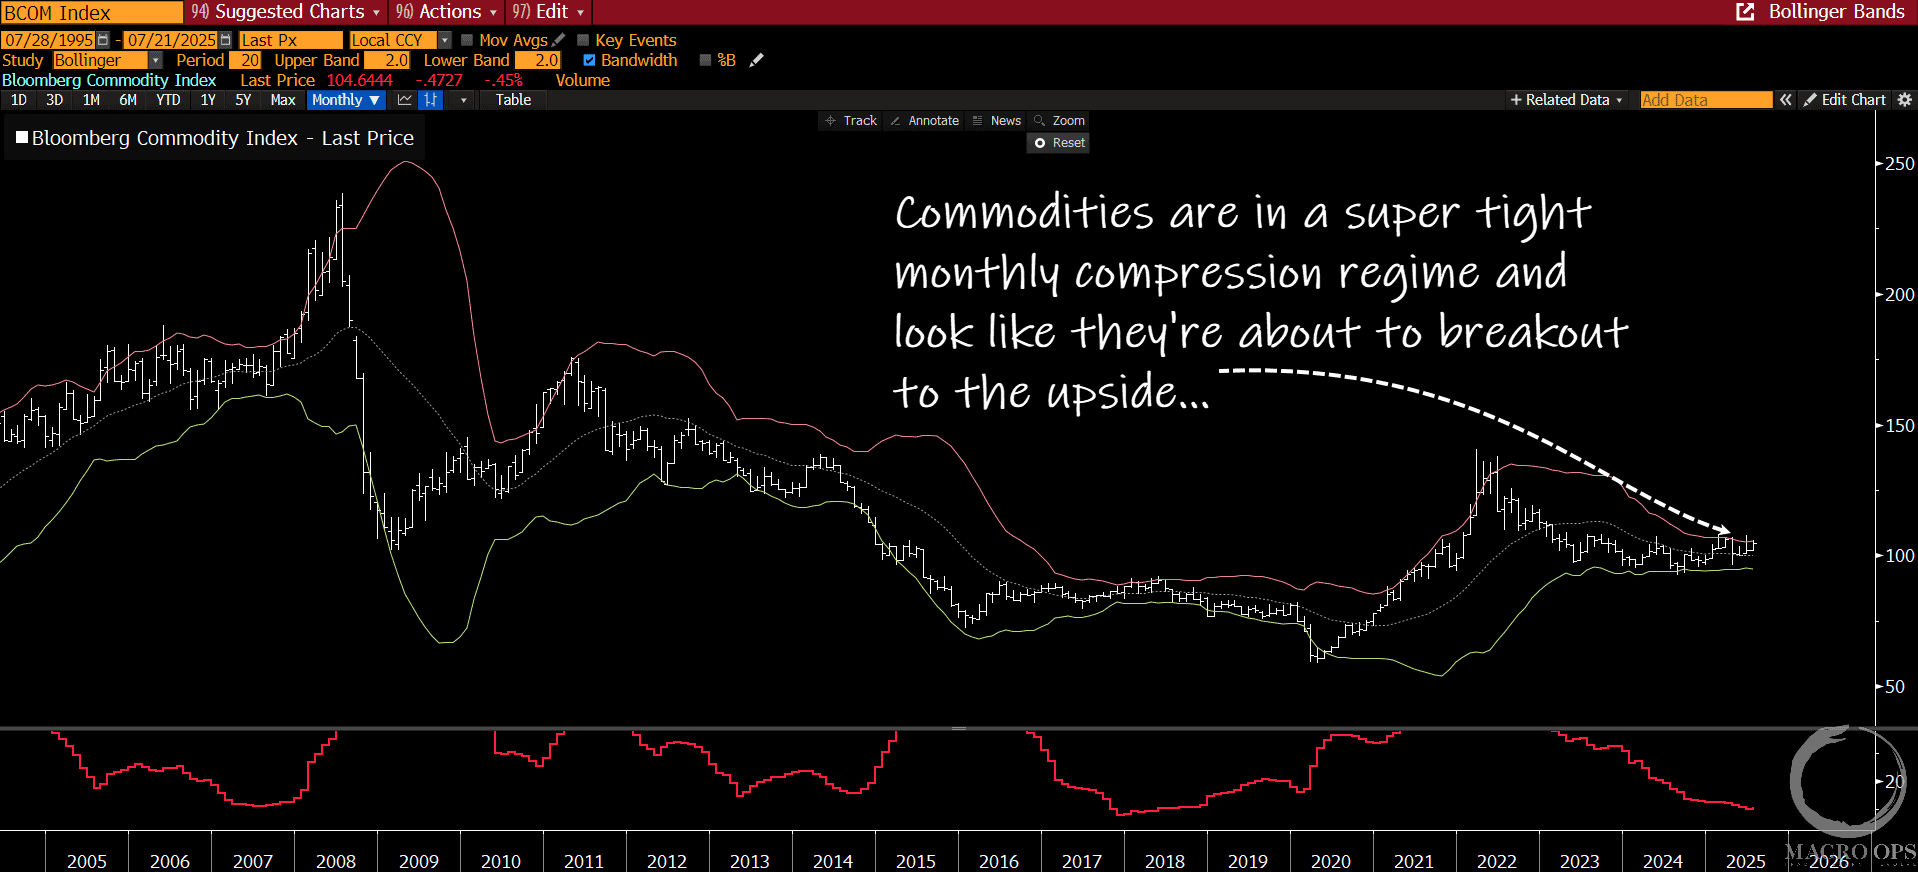
Commodities are in a MAJOR 2yr+ compression regime and look like they’re about to make a move to the upside. If this happens, it’ll have huge implications for bonds (all the charts above), which will then ripple through to everything else.
We’ll be looking to get long DBC or BCI through equity and/or calls soon.
(Click on image to enlarge)

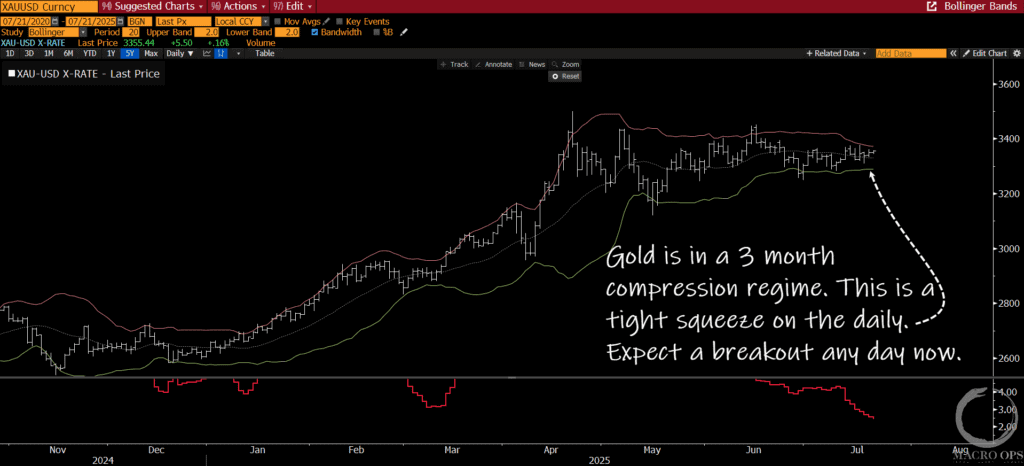
Gold is in a short 3 3-month-long long, but highly compressed regime. We should expect a breakout and trend resumption any day now. We are long and will be aggressively adding upon a bullish breakout.
Gold tends to lead other macro instruments at major assets. The current bull leg in gold started in 24’ and doesn’t look to be stopping. This tells me we likely see the commodity index soon follow, along with global DM yields.
(Click on image to enlarge)
There’s a number of major setups within key macro assets right now. We have a directional bias about which way many of these compression regimes will resolve themselves — I’ll be issuing a Market Note this week outlining this bias and making the case for why we hold it.
However, our process emphasizes fallibility, as we’ve gorged on humble pie too many times to count over our careers… So, though we’re going to start putting on small starter positions in a number of the above markets. We will respectfully listen to the market and wait for it to tip its hand before we decide to press ours.
Let’s do a quick run-through of our key indicators to update our market view.
MO Heads-Up-Display (HUD) Indicators:
- Trend Fragility and Risk Cycle: Two measures of short and long-term risks (ie, leveraging, FOMO chasing, etc…) in markets continue to give the all clear and support the broader uptrend. However, a few of the individual components that measure short-term risk-taking are starting to heat up. But both are still far from giving a sell signal.
- Market Internals: Generally remain supportive of the broader uptrend. No signs of any major deterioration that precede significant corrective moves.
- MO Liquidity indicator: Still flush, though might be slowly starting to roll over. Bears watching.
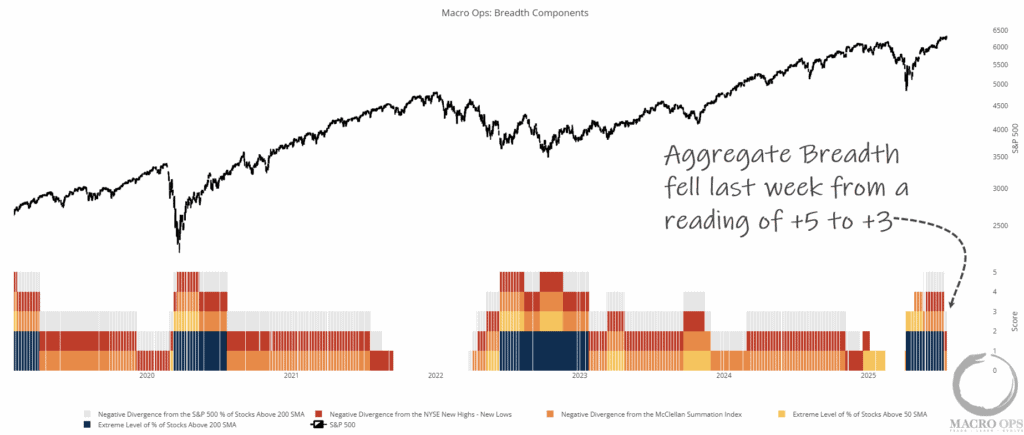
- Aggregate Breadth: Dropped two points from a strong reading of +5 to +3 last week. This is still a bullish reading, but it typically coincides with a more volatile uptrend.
(Click on image to enlarge)
- CoT Positioning:
- Commodities: Crowded longs in feeder cattle and silver. Crowded shorts in soybean meal, sugar, rough rice, cotton, and corn.
- Equities: Crowded longs in Nasdaq 100 and crowded shorts in Russell 200
- Currencies: Crowded longs in JPY and crowded shorts in AUD and DXY
- Debt: Crowded longs in 30yr UST bond and crowded shorts in 5yr UST Note
Weight of the evidence:
Sorry bears, but the data + tape say this trend is headed higher — albeit with rising volatility and pullbacks along the way. And when the inevitable correction does come, the weight of the evidence tells us it’ll be minor, in the 4-7% range.
Final thoughts and trade setups
I’ll be putting out a Market Note this week where I’ll be diving into the macro side of the data that’s driving the compression in the key markets talked about above.
There’s two competing narratives around growth and inflation, and their pretty evenly split. But there’s some important macro catalysts occurring on the horizon, and most of them are largely going unnoticed. I believe these developments will force breakouts from these compression regimes and drive new trends, which will have profound implications for global markets as a whole.
So keep an eye out for this one to hit your inbox shortly.
Moving on…
I’ve already mentioned the actionable gold setup. We’re long and will add on a positive breakout, which I expect any day now.
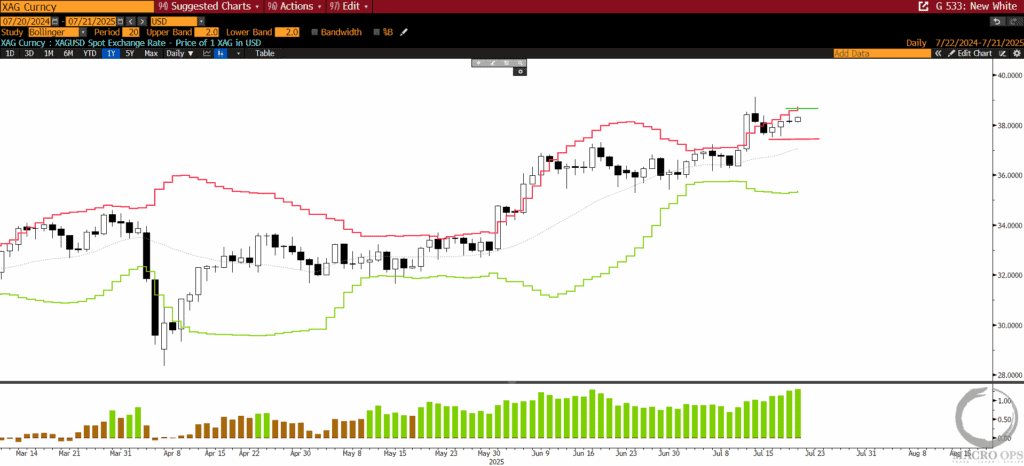
We are also long silver. And we’ll be looking to add to our position on a move above Friday’s high, with a stop right below last week’s low.
(Click on image to enlarge)
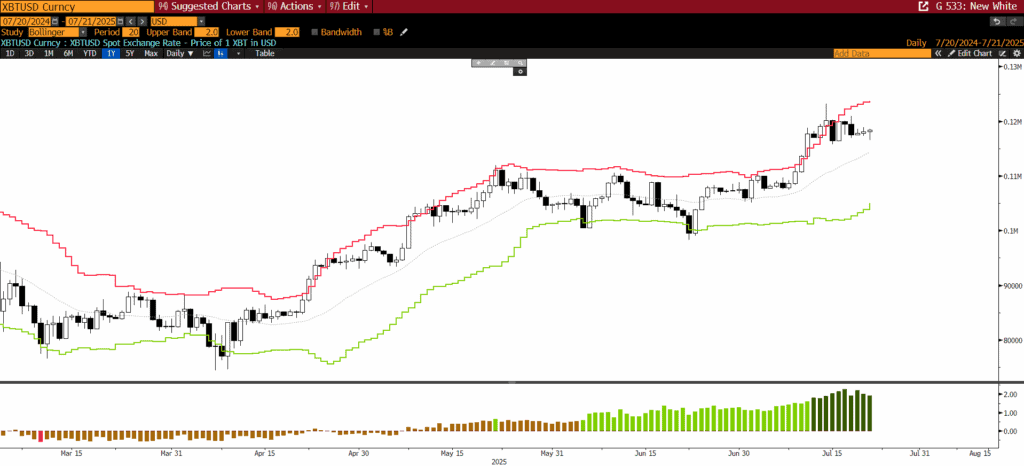
BTCUSD has a similar setup to silver as the two are increasingly trading off the same drivers.
We’re positioned long and may look to add for a third time on a move above last week’s high. Look out for my partner Chris’s note going out tomorrow, where he’ll update the signals on our crypto trend/momentum systems.
(Click on image to enlarge)
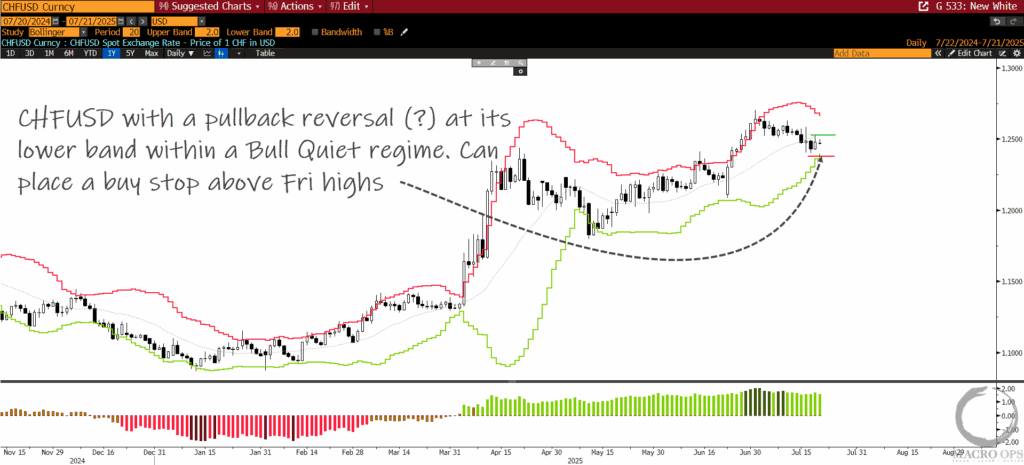
We’re currently long USDJPY and USDSEK as we’re expecting a positioning reset in USD. With that said, I’m becoming increasingly convinced that the cyclical trend in the dollar is now down. So while we’re long and hoping to catch a multi-month correction, I’ll be looking for spots to re-enter the short USD trade once I feel we’ve seen enough of a sentiment reset.
We were previously long CHF and MXN but took profits a couple weeks ago. I still like these two and will be looking to get back in when given the chance.
(Click on image to enlarge)
One recent chart that caught my eye is that from Chalice Mining (CHN.ASX). It’s been in a 2yr sideways base and compression regime. And it’s now attempting to break out from.
CHN is an Aussie-based miner of critical minerals, specifically PGEs: nickel, copper, and cobalt, along with a bit of gold.
(Click on image to enlarge)
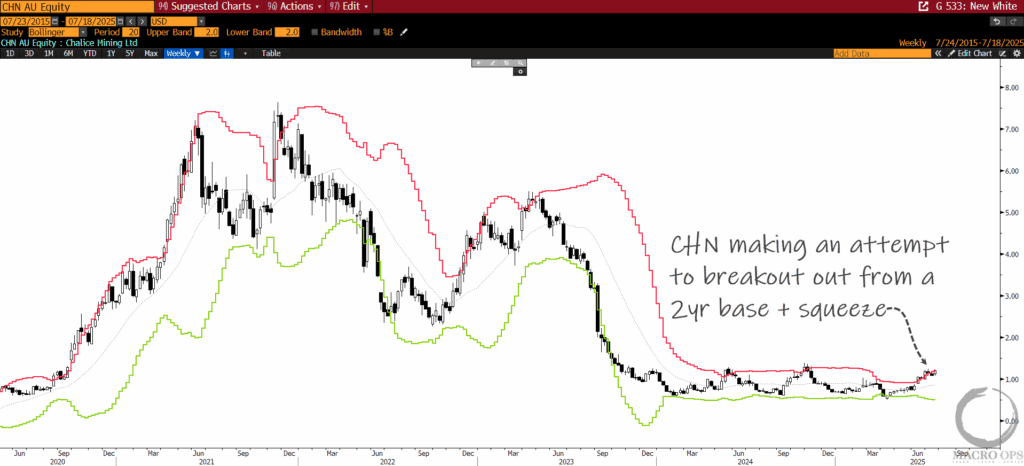
CHN’s bull case centers on its globally significant Gonneville discovery, which positions the company as a future supplier of critical minerals essential to the energy transition. With a projected mine life of over 20 years, Gonneville has the potential to become one of the largest and most sustainable PGE-Ni-Cu-Co operations in the Western world.
We’ll be digging a bit more into CHN.ASX soon to see if it’s worth adding to our PGM basket.
That’s it for this week.
More By This Author:
The Long Pull: PGMs Are RippingGold Is Correcting In Time, Not Space
Bulls Remain In Control
Housekeeping note: If you’d like to join the Macro Ops Collective and get full access to this unique community and all the research and tools that come with it, more


