Precious Metals Pullback Is Losing Momentum
Image Source: Unsplash
After a volatile few weeks of trading, it appears that precious metals and miners are beginning to stabilize. The sharp pullback following their strong rallies seems to be subsiding, and much of the frothy sentiment has now been cleared out.
This sets the stage for a period of stabilization and recovery, which should allow the precious metals bull market to continue. In this update, I will show you where precious metals and miners currently stand and what I expect next.
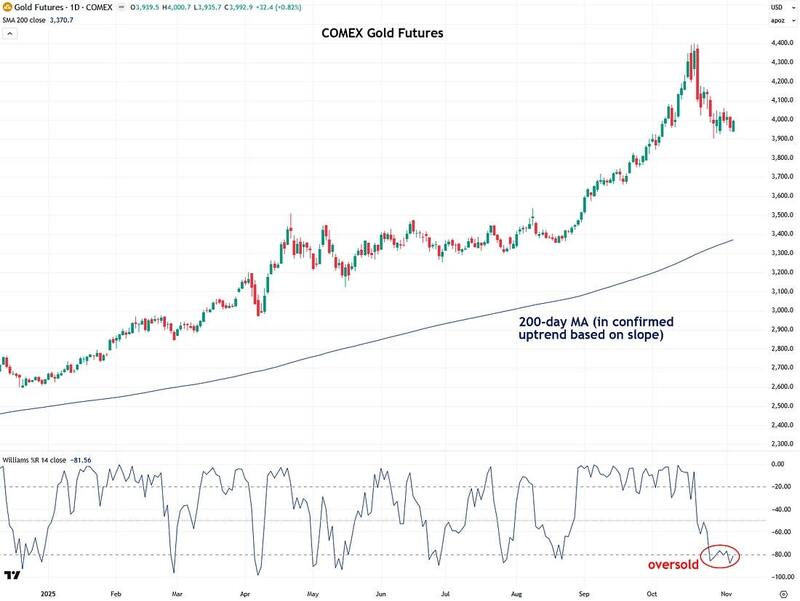
Let’s start with gold, which leads the overall precious metals space. After being strongly overbought throughout September and the first half of October, according to the Williams %R indicator below the price chart, gold’s pullback in the second half of October helped to work off that overbought condition and the frothy sentiment that came with it.
Gold and other precious metals are now oversold within confirmed uptrends. This typically signals that a pullback is nearing its end and often presents a good opportunity for dip buyers or those looking to dollar-cost average.
This setup positions gold to resume its ongoing bull market, which remains intact and has many years left to run. That said, before calling the pullback complete, I want to see how a specific intraday chart pattern plays out, which I will show next.
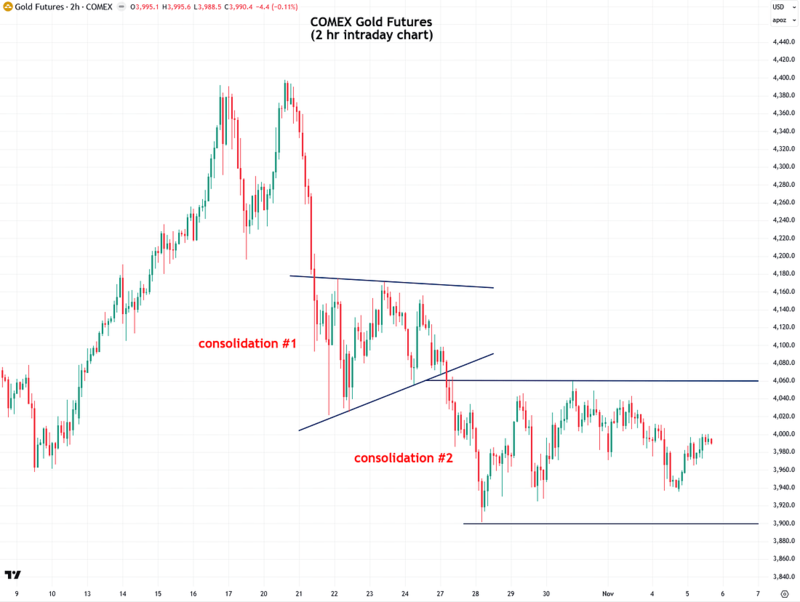
As I’ve explained in recent updates, two consolidation patterns formed on gold’s 2-hour intraday chart, labeled “Consolidation #1” and “Consolidation #2” in the chart below. On October 26th, I pointed out “Consolidation #1” and noted that it could break in either direction, and it ended up breaking to the downside.
Over the past week, I’ve been monitoring Consolidation #2 and have redrawn the support and resistance lines to be horizontal and parallel, as the pattern continued to form. Also, horizontal technical levels are more significant and reliable than diagonal ones.
In this case, support is roughly at $3,900, and resistance is around $4,060. I’m looking for a decisive breakout in one direction or the other to confirm the next move for gold, which will also have strong implications for the entire precious metals space. This makes Consolidation #2 especially important to watch.
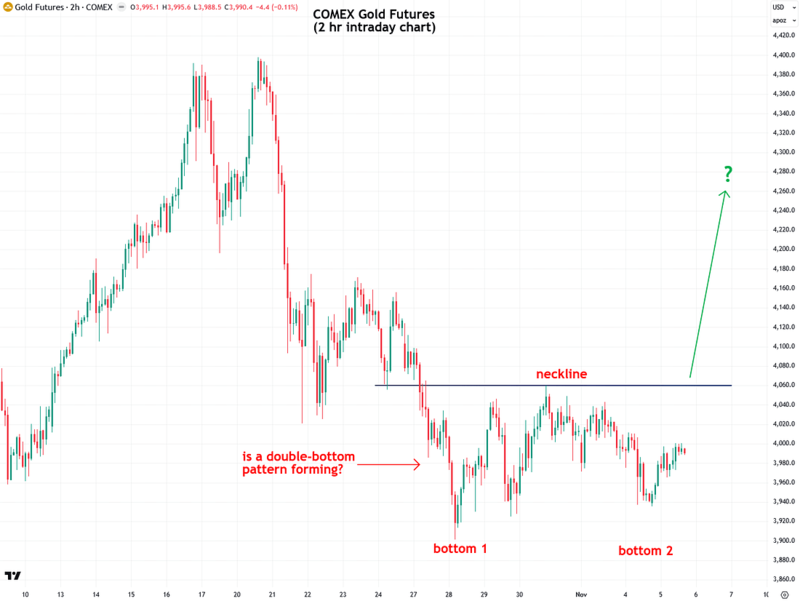
As Consolidation #2 continues to hold without breaking down, it raises the prospect that it may be transforming into a bullish double-bottom pattern. This is especially relevant given that gold is currently oversold on the daily chart while remaining in a strong uptrend, a condition that often leads to bounces.
To confirm this potential scenario, we need a decisive close above the neckline resistance at $4,060.
If that breakout occurs, it could signal a strong rebound not only for gold but also across the entire precious metals complex. This setup is worth watching closely.
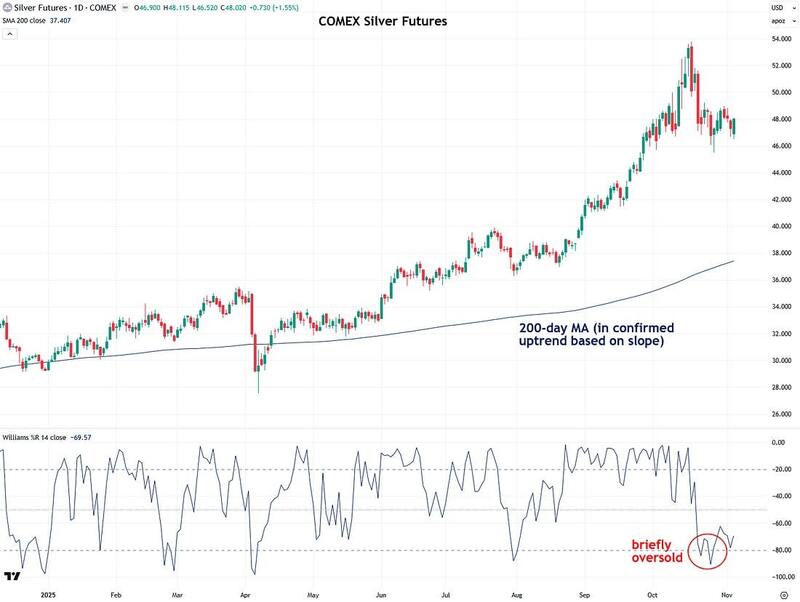
Next, let’s look at silver, which became oversold in late-October and has since rebounded slightly out of oversold territory, although the Williams %R indicator remains near the lower end of its range.
My view is that silver is in a very good position and, importantly, never became as overheated as gold during the recent rally. Because of that, this pullback phase shouldn’t be as sharp as gold’s, accounting for the natural differences in volatility between the two metals.
Right now, my instinct is that silver is forming a consolidation pattern to catch its breath before making another push to close above the critical $50 level, and this time it should finally succeed and continue much higher from there.
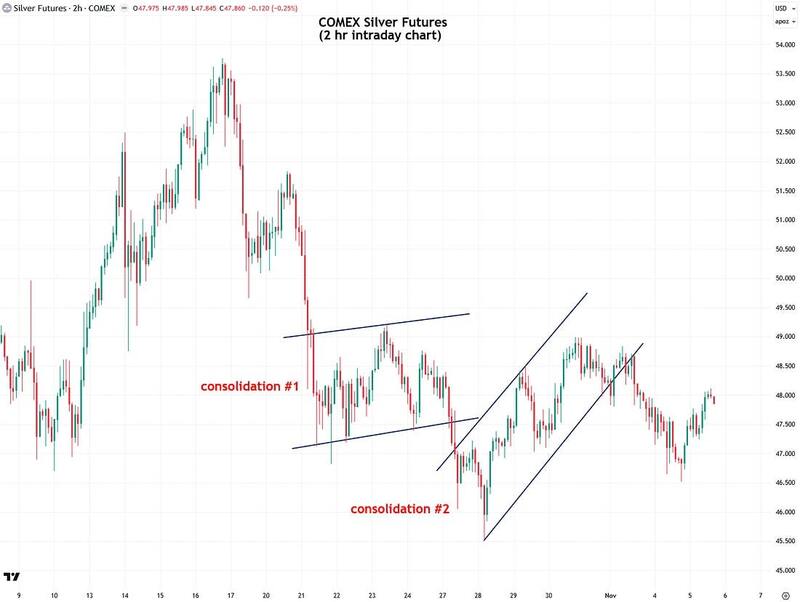
Similar to gold, I’ve been showing two consolidation patterns on silver’s 2-hour intraday chart. The second pattern did break down on Tuesday, but there was little follow-through to the downside, which is encouraging.
This likely reflects the fact that silver has already completed a pullback on the daily chart, with sentiment having reset and much of the froth removed. This creates a favorable setup for a rebound and continuation of silver’s overall bull market.
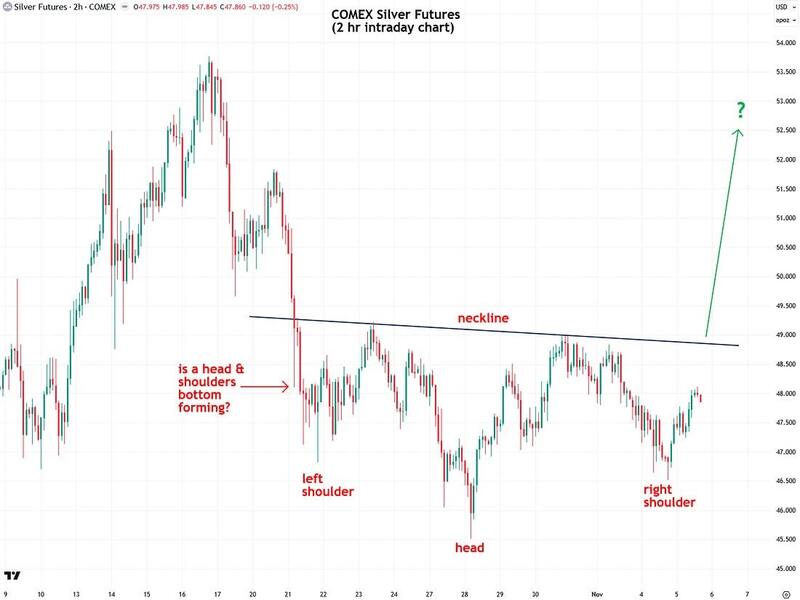
There is also a possibility that a bullish inverse head-and-shoulders bottom pattern is forming on silver’s 2-hour intraday chart, in parallel with gold’s potential bullish double-bottom pattern.
This setup is supported by the fact that silver is oversold on the daily chart while still holding within a strong uptrend, which is a condition that often leads to meaningful bounces. The key confirmation would be a solid close above the neckline resistance around $48.75 on COMEX futures.
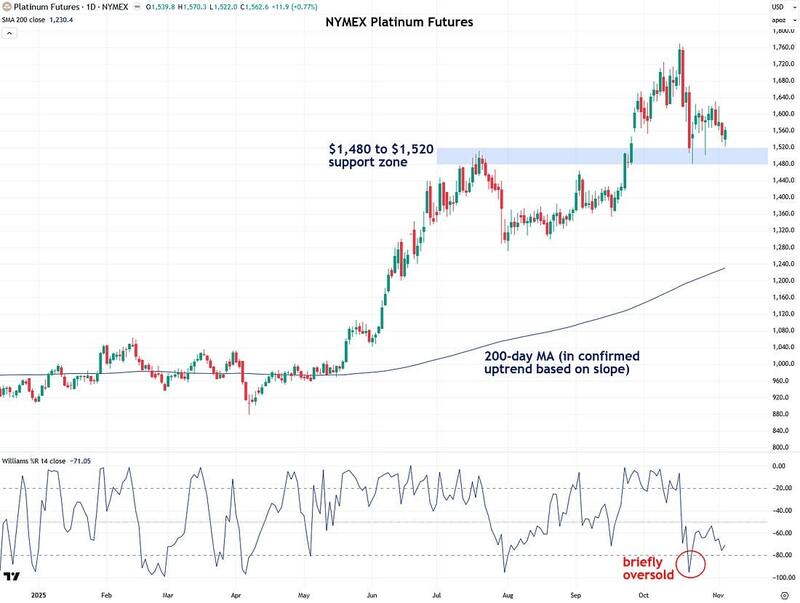
Next, let’s take a look at platinum. As the Williams %R indicator beneath the chart shows, platinum quickly became oversold during the recent pullback.
This is because its rally was more recent and less extended, meaning it didn’t require as much of a pullback to reset. Since then, the Williams %R has bounced slightly but remains near the lower end of its range.
In addition, platinum appears to have found support in the $1,480 to $1,520 zone, which formed around the July peak. There is a good chance it will rebound from this level, especially if the intraday chart patterns in gold and silver, which lead the overall precious metals complex, break to the upside.
I’m still very bullish on platinum, and the recent turbulence does absolutely nothing to change that outlook.
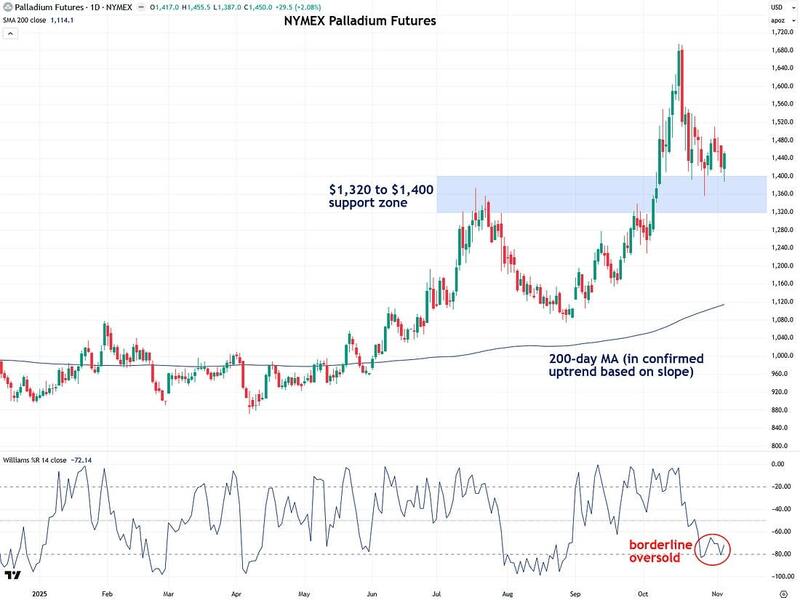
Similarly, palladium experienced a healthy reset during this pullback and became nearly oversold, though not entirely. That’s reasonable, as it never became excessively frothy to begin with, unlike gold.
In addition, it appears to be finding support in the $1,320 to $1,400 zone and is likely to bounce from this level and continue its bull market, assuming the rest of the precious metals complex rebounds as well.
I’m still very bullish on palladium, and the recent volatility has done nothing to alter that outlook.
The drop in rate cut expectations was triggered by comments from Fed Chair Jerome Powell during the press conference following the October 29 rate decision. He stated that another cut in December is “far from” guaranteed and not a “foregone conclusion.”
This shift in outlook has also contributed to the recent pullback across other assets, including stocks and cryptocurrencies, although they now appear to be stabilizing.
At the same time, while interest rate cuts and expectations around them may influence precious metals prices in the short term, they do not determine their long-term value, which remains significantly higher from current levels.
That’s why I view short-term fluctuations as noise and remain focused on the strength of the long-term bullish thesis.
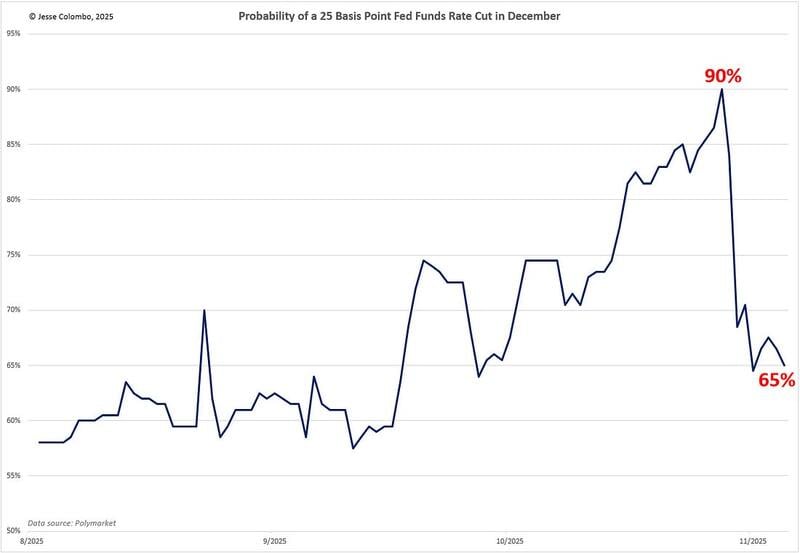
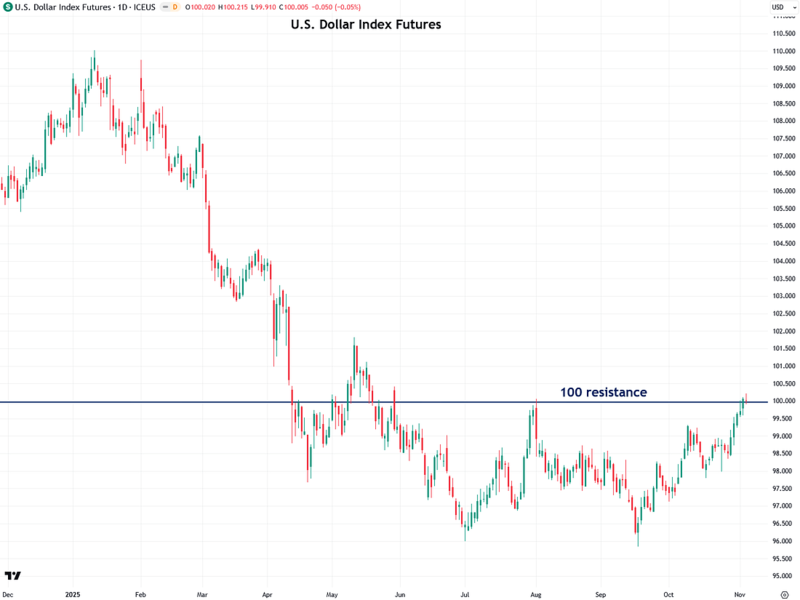
The recent decline in rate cut expectations has led to a rebound in the U.S. Dollar Index from its September lows, which has also weighed on precious metals, since the dollar and precious metals have an inverse relationship.
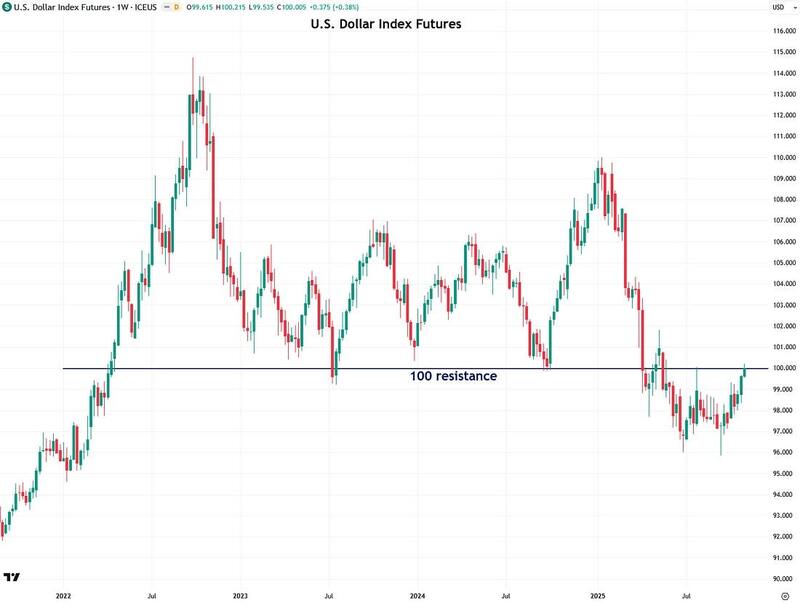
However, the Dollar Index has now rallied into the significant 100 resistance, a key level that has been in play for several years, as I will show shortly.
It is important to watch how the Dollar Index behaves at this level, as it will influence the direction of precious metals. If the index fails to surpass the 100 resistance and turns lower, that would likely act as a major catalyst for gold and silver to bounce from their current oversold conditions.
On the other hand, if the Dollar Index closes decisively above 100, that would apply further pressure on precious metals. However, I view that scenario as less likely, given how overvalued the U.S. dollar is. A rejection at 100 seems to be the more probable outcome.
The U.S. Dollar Index’s weekly chart highlights the significance of the 100 level, which now serves as major overhead resistance. This level acted as strong support throughout 2023 and 2024, with several rallies beginning from it.
However, the index broke below it this past spring, signaling a notable change in trend. That breakdown is a key reason why I currently hold a bearish bias on the dollar.
My working theory is that the recent rebound is simply a retest of this former support—now resistance—and that the index is likely to turn lower from here. That said, I always aim to stay flexible and remain guided by what the market is showing me.
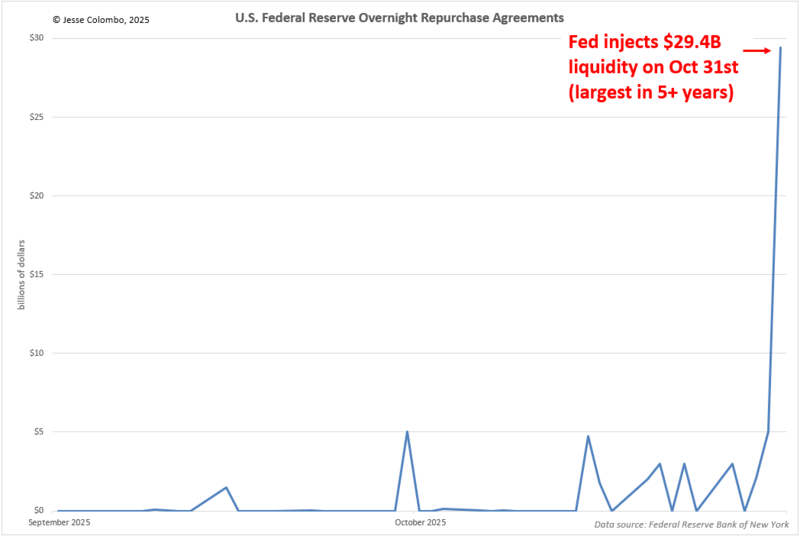
Stress is building beneath the surface of the U.S. financial system. This recently became apparent when overnight repo demand spiked to $29.4 billion on October 31st.
A similar development took place in September 2019 and ultimately played a key role in the launch of the major quantitative easing (QE) programs just months later, introduced under the cover of COVID-19 stimulus.
I’ve been expecting an eventual return to QE, and this development is likely to accelerate that process. That outcome would also be extremely bullish for precious metals and bearish for the U.S. dollar.
To wrap up, the pullback in precious metals and miners appears to be losing momentum, and the longer they stay oversold, the stronger the eventual rebound is likely to be. That said, I’m still watching how the intraday consolidation patterns in gold and silver resolve, because those will be key in determining what comes next.
I’m increasingly feeling optimistic about short-term price action. As always, I’ll keep you updated on what I’m seeing.
More By This Author:
Is The Precious Metals Pullback Over?
Precious Metals Are Officially Oversold
Why Precious Metals Are So Volatile Right Now
For the author's full disclosure policy, click here.


