
Precious Metals Are Officially Oversold

Image Source: Unsplash
For the past week or so, during the pullback in precious metals and miners following their powerful early-fall rally, I have been sharing various analyses to estimate when the pullback will be over and when precious metals and miners can resume their predominant path, which is a secular bull market that has at least another decade of life left.
One of the key signals I was watching to determine whether the pullback had basically run its course was the appearance of oversold readings across the board in all major precious metals and mining stock ETFs.
Until now, that had not happened, which led me to believe there was still some further downside ahead. As of yesterday, however, the entire precious metals space is now oversold, which is a significant development that indicates the pullback is getting very close to ending. Let’s take a look at where things stand now.
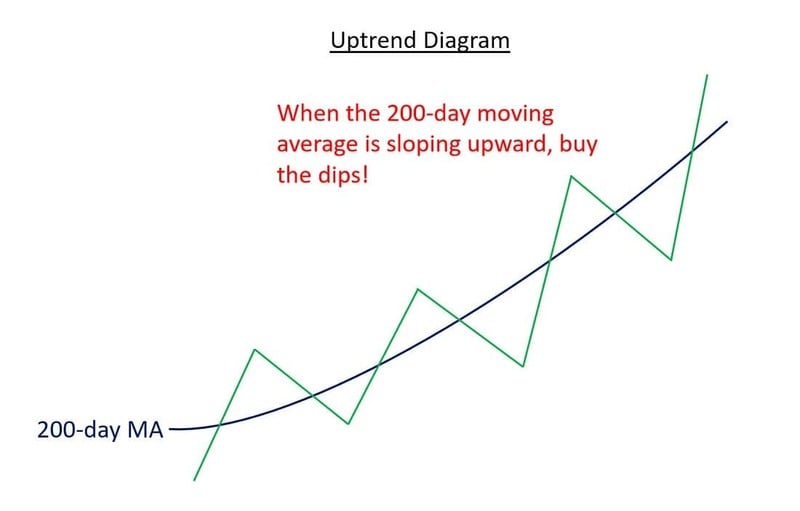
I always start by identifying the primary trend, whether it is up, down, or sideways. I determine this by looking at the slope of the 200-day moving average. If the slope is rising, that indicates an uptrend, which is an environment that favors buying dips, especially when confirmed by oversold readings in the Williams %R indicator.
The diagram below illustrates this basic principle. This is important because with precious metals and miners now oversold across the board, while still in strong and confirmed uptrends, the setup is giving a classic buy-the-dip signal, as I will show throughout the rest of this update.
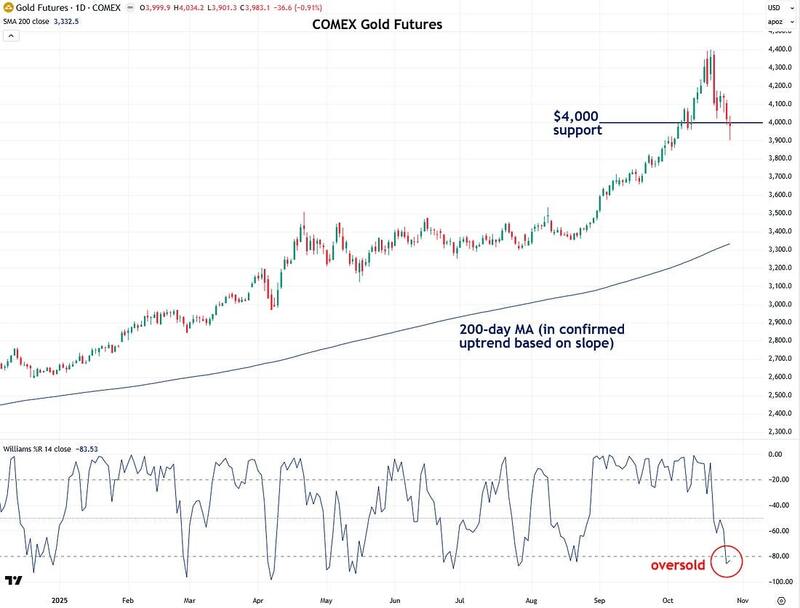
Let’s start with gold, which leads the overall precious metals space. Until yesterday, it had not reached oversold levels according to the Williams %R indicator (shown below the price chart) during the course of its pullback.
In my last couple of updates, I mentioned that I would prefer to see gold enter oversold territory before gaining more confidence that the pullback had largely run its course.
As of yesterday, following another decline of nearly 1%, gold is now officially in oversold territory while still remaining in a strong, confirmed uptrend, as indicated by the upward-sloping 200-day moving average.
This combination is a classic signal that the worst of the pullback is now behind us. However, there are still a few other conditions I am watching for, which I will cover toward the end of this update.
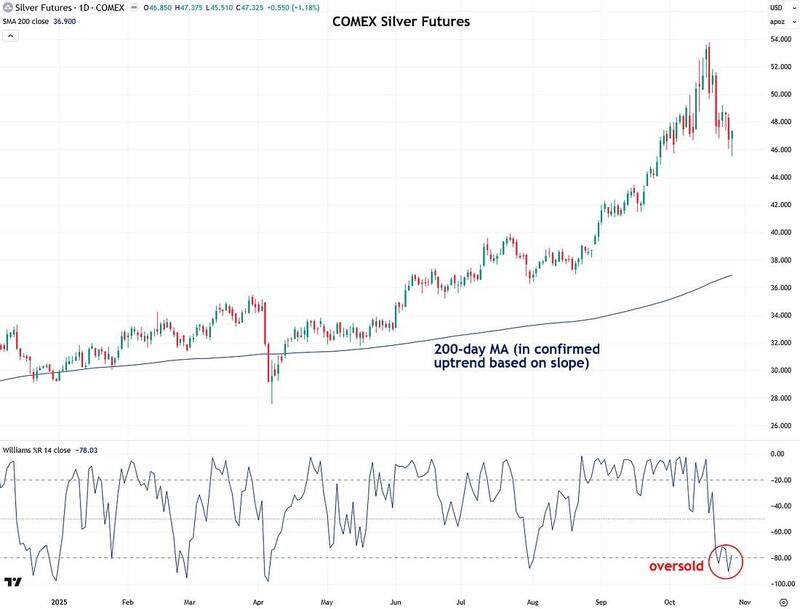
Unlike gold, silver has already been in oversold territory for several days and continues to stay there, while the 200-day moving average confirms that it is in a strong uptrend. Silver is now in a much better position, having worked off its previous froth.
It appears to be stabilizing and setting up for the next leg of the larger bull market that I continue to expect. In that scenario, I still anticipate silver surging to $60, $70, $80, and well beyond.
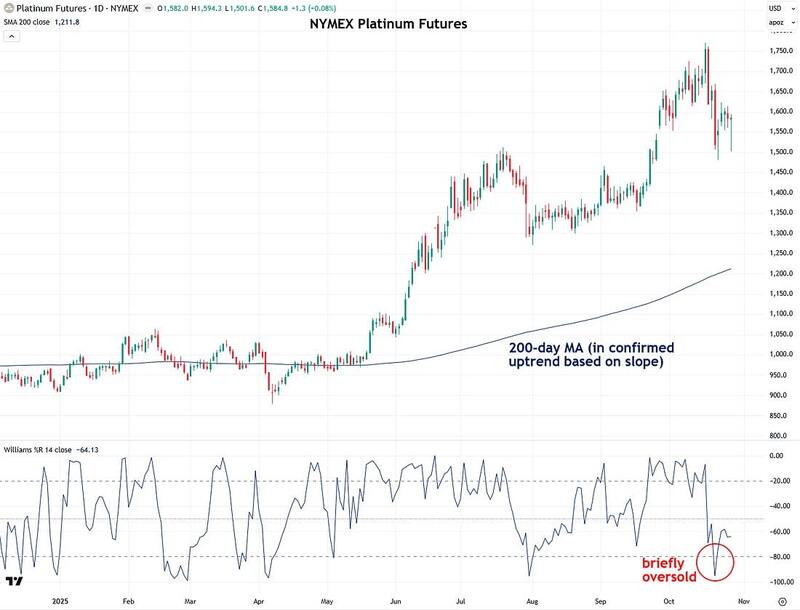
Platinum quickly became oversold during the recent pullback because its rally was more recent and less extended, so it didn’t need to correct as much to reset. Since then, the Williams %R indicator has bounced back somewhat but still remains near the lower end of the range.
I’m still very bullish on platinum, and the recent turbulence does absolutely nothing to change that outlook.
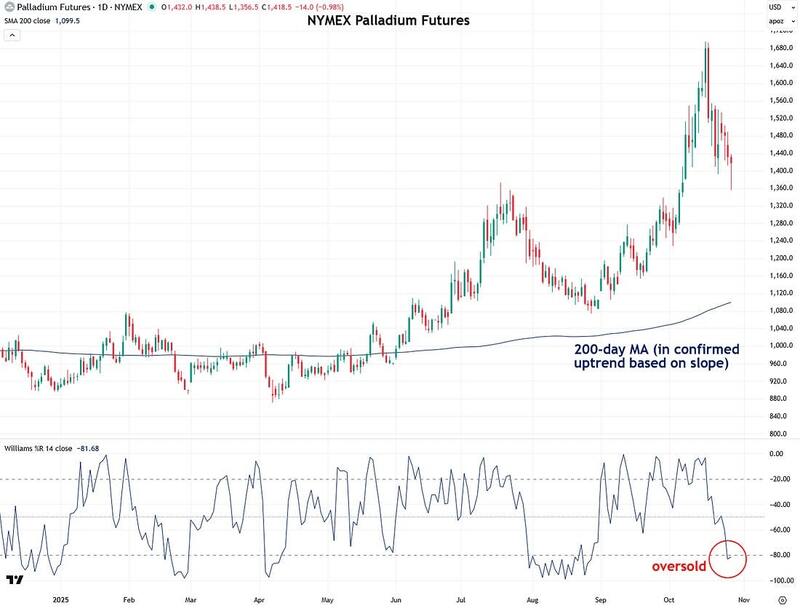
Like gold, palladium had not yet reached oversold territory as of my last update two days ago, but it finally did yesterday, which is an encouraging sign, especially in conjunction with its confirmed uptrend based on the 200-day moving average.
I’m still very bullish on palladium, and the recent volatility has done nothing to alter that outlook.
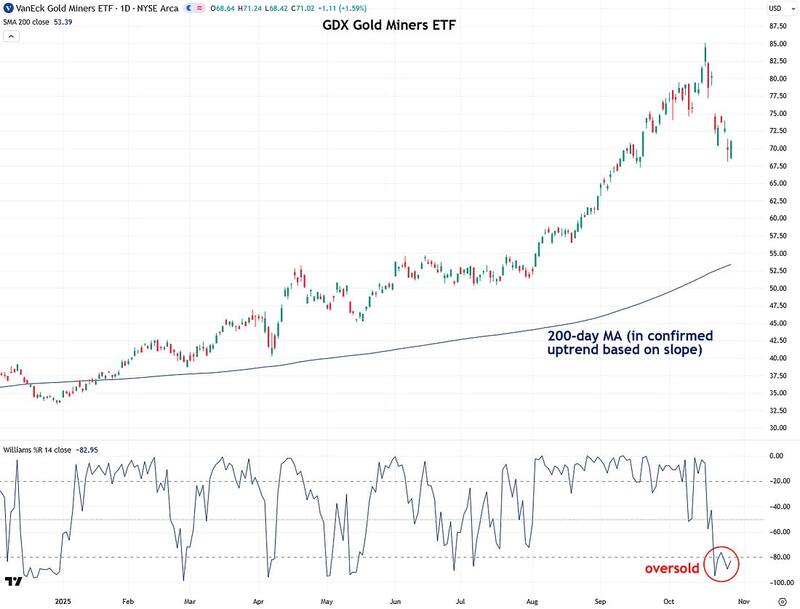
Next, let’s look at the mining stock ETFs, starting with the popular VanEck Gold Miners ETF (GDX). It is in a confirmed uptrend, as indicated by the upward-sloping 200-day moving average, and has been in oversold territory for several days.
This indicates that the pullback has largely run its course and that GDX should begin stabilizing and resuming its uptrend soon.
I’m still very bullish on both gold and silver mining stocks, and their continued undervaluation should provide cushion against further downside.
Based on everything we’ve seen, the entire precious metals and miners space has worked off its prior froth and is now oversold, while the longer-term uptrend remains intact. That is as close to a textbook “buy the dip” signal as you can find. However, I also look for additional confirmation, as I prefer to avoid trying to catch a falling knife if possible.
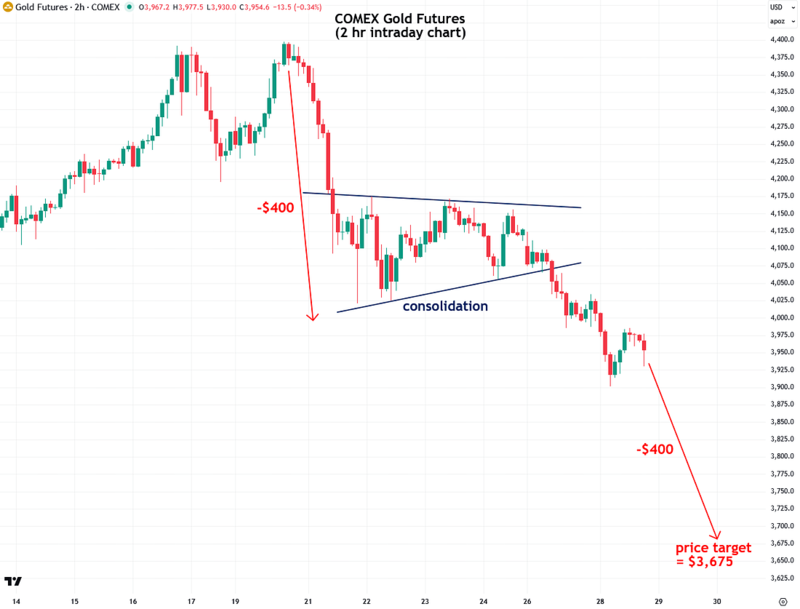
What I’m still watching closely is the intraday consolidation pattern in gold and the other metals. That pattern broke down on Monday, leading to further declines.
There is still a chance that this breakdown has a bit more to go if we apply the concept of a measured move, which involves projecting a price target based on the size of the move leading into the consolidation and extending that same distance beyond it.
In gold’s case, the move leading into the consolidation was a $400 decline. Projecting that downward gives a potential target around $3,765. I’m not saying this must happen or that it’s guaranteed, but it is a scenario worth keeping in mind.
If gold manages to close decisively back above the key $4,000 level, I would consider this hypothetical scenario to be averted.
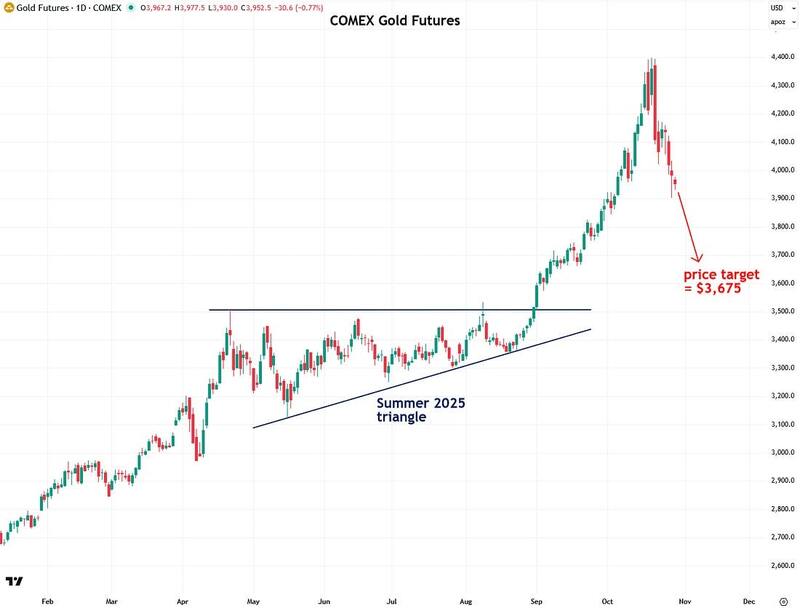
The daily chart of gold shows what could happen if the measured move scenario plays out. It would erase a good portion of the September and October price surge, although gold would still remain higher than where the rally began.
If that scenario unfolds, I believe it would take the form of a quick flush, similar to ripping off a Band-Aid, and then set the stage for a sharp snapback rally that would drive gold to $5,000 relatively quickly, leaving those who sold in a panic filled with regret.
As the saying goes, bull markets climb a wall of worry and are designed to keep the fewest people on board. Investing can be incredibly frustrating at times, often feeling like riding a bucking bronco.
I completely understand that experience and sympathize with it. Again, I’m not saying that this scenario is guaranteed to play out, but it’s important to be aware of the possibility. It’s better to be prepared than caught off guard.
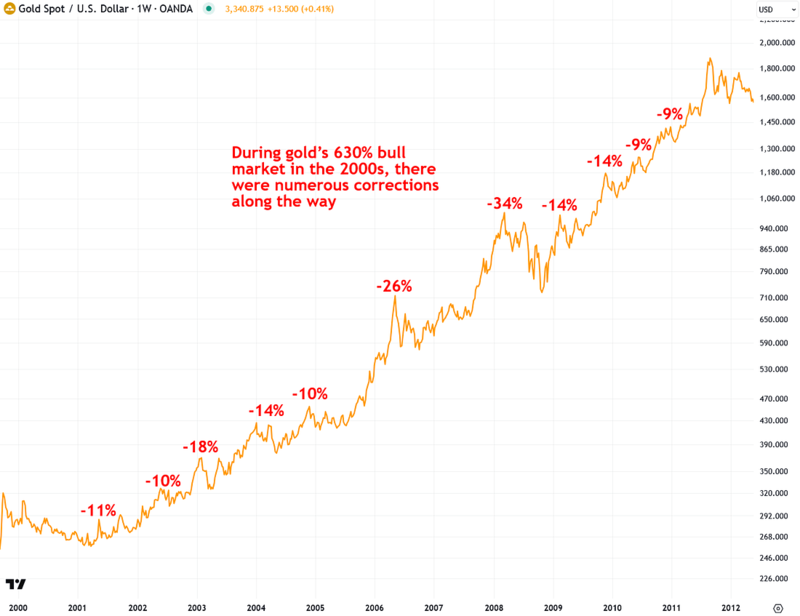
The last chart I want to leave you with is of gold’s 630% secular bull market during the 2000s. To put that gain into perspective, the current bull market in gold, which began in March 2024, had only reached a peak gain of 120%.
I believe gold is in another secular bull market similar to the one in the 2000s, and that it still has much further to run in the years ahead. However, pullbacks are inevitable, and it is best to expect them and come to terms with that reality.
What I want to highlight from the chart is just how many pullbacks and even full-blown corrections occurred along the way. In hindsight, after such a large overall gain, it is easy to look at those pullbacks and assume they were easy to endure.
But that is a very different perspective from someone who actually lived through them at the time, without knowing whether the bull market was officially over and if gold would plunge 50% or more and remain down for decades.
It is also important to understand that pullbacks and corrections are not unique to gold and silver bull markets. The same pattern occurred in ALL major long-term winners, including Nvidia, Google, Apple, Walmart, the S&P 500, Bitcoin, and even Warren Buffett’s conservative Berkshire Hathaway. There is no avoiding pullbacks. They are simply part of the investing journey. Volatility is the price of admission, and for long-term investors, it has proven to be well worth it.
In conclusion, for the first time since the recent pullback, all major precious metals and mining stock ETFs are in oversold territory, while their uptrends remain firmly intact. This is a classic sign that the pullback is nearing its end and that a solid dip-buying opportunity is emerging for those looking to dollar cost average.
However, it is still important to keep in mind the caveat of the intraday consolidation pattern in gold. I am watching to see whether it will result in further downside.
However, a solid close back above the key $4,000 level would signal that this risk scenario is no longer in play. As always, I will keep you updated on what I’m seeing.
More By This Author:
Why Precious Metals Are So Volatile Right NowHow To Know When The Precious Metals Pullback Is Over
Silver Clears $50, Breakout Confirmed
For the author's full disclosure policy, click here.


