
Is The Precious Metals Pullback Over?
Over the past couple of weeks, I’ve been writing updates tracking the routine and healthy pullback in precious metals and mining stocks to determine whether it has further to go or is nearing completion.
In my last update on October 28th, I noted that both precious metals and mining stocks had become oversold, which, in the context of a confirmed uptrend like the one we’re currently in, typically signals that the pullback is close to ending and usually offer a good opportunity for dip buyers and those looking to dollar-cost average.
In today’s update, I want to show where gold and silver stand now, along with important intraday chart patterns that provide strong clues about what might come next.
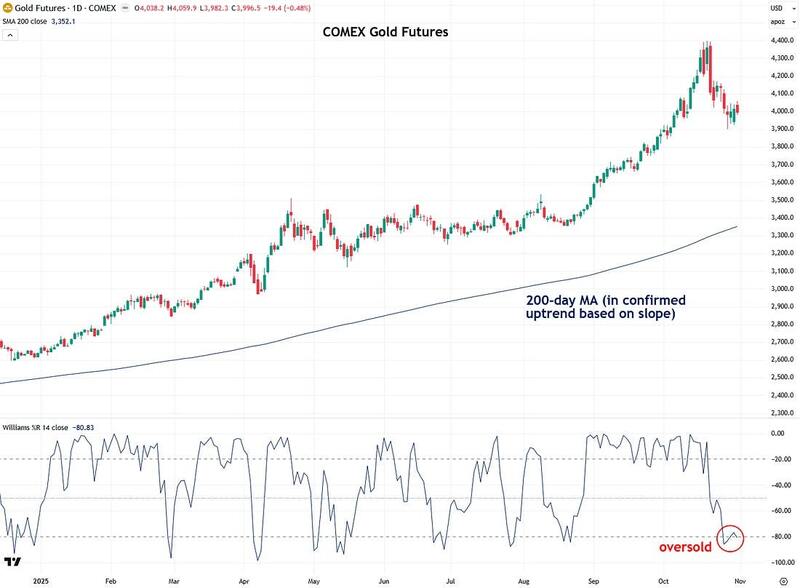
Let’s start with gold, which leads the overall precious metals space. After being strongly overbought throughout September and the first half of October, according to the Williams %R indicator below the price chart, gold’s pullback in the second half of October helped to work off that overbought condition and the frothy sentiment that came with it.
This now positions gold to resume its ongoing bull market, which remains intact and has many years left to run. That said, before calling the pullback over, I want to see how a specific intraday chart pattern resolves, which I will show shortly.
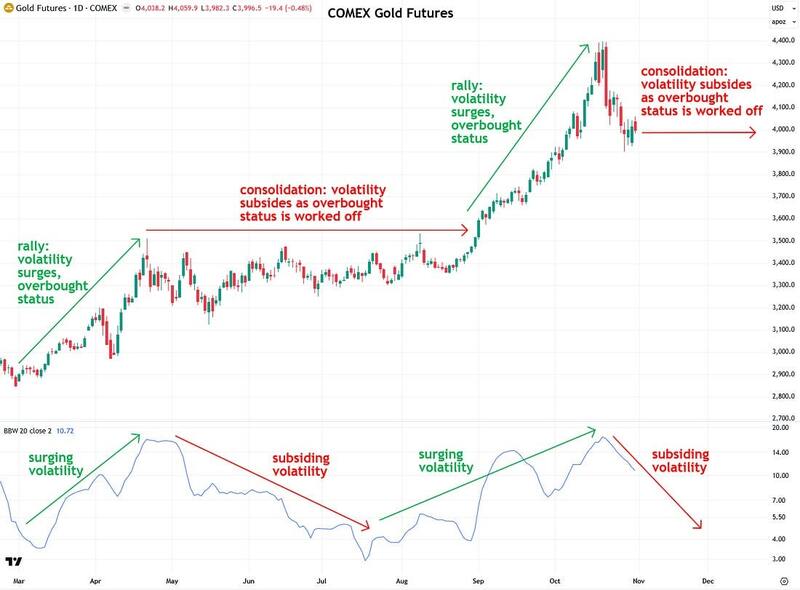
After a surge in volatility during the gold rally in September and early October, as measured by the Bollinger Band Width indicator beneath the price chart, volatility is now subsiding in gold and across the broader precious metals complex. This indicates that precious metals are likely forming a new consolidation phase as they build energy for the next major move.
The current setup is similar to what occurred in the spring, when a sharp rally was followed by a subsidence in volatility and a period of sideways movement. However, I don’t necessarily believe that another four months of consolidation is required this time, given how brief the recent rally has been.
This consolidation should help gold conserve and build energy for its next move higher, which I expect will take it to $5,000 in 2026. That outlook is shared by major institutions including Goldman Sachs, Bank of America, HSBC, and Société Générale. In addition, JPMorgan CEO Jamie Dimon, who is not known for being a gold advocate, recently said that gold “could easily go to $5,000 or $10,000 in environments like this.”
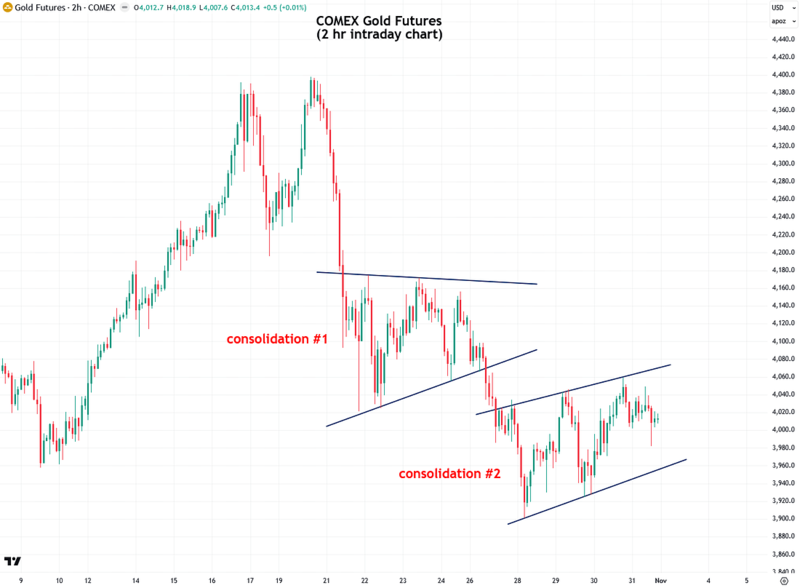
Gold is officially oversold within an uptrend, which is typically a bullish signal, but there’s one more development I want to see play out first. A consolidation pattern is currently forming on the 2-hour intraday chart, labeled “Consolidation #2” on the chart below. On October 26th, I pointed out “Consolidation #1” and noted that it could break in either direction, and it ended up breaking to the downside.
I’m now watching to see how this second consolidation resolves. If it breaks lower, that should mark a final quick flush that hits sentiment and sets the stage for a strong rebound. On the other hand, if the recent pullback is already complete, I would expect an upside breakout with a convincing close above the key $4,000 level, which would indicate that the uptrend is resuming. As always, my motto is: don’t predict, react.
Next, we move on to silver, which became oversold last week and has since rebounded slightly out of oversold territory, although the Williams %R indicator remains near the lower end of its range. My view is that silver is in a very good position and, importantly, never became as overheated as gold during the recent rally. Because of that, this pullback phase shouldn’t be as sharp as gold’s, accounting for the natural differences in volatility between the two metals.
Right now, my instinct is that silver is forming a consolidation pattern to catch its breath before making another push to close above the critical $50 level, and this time it should finally succeed and continue much higher from there.
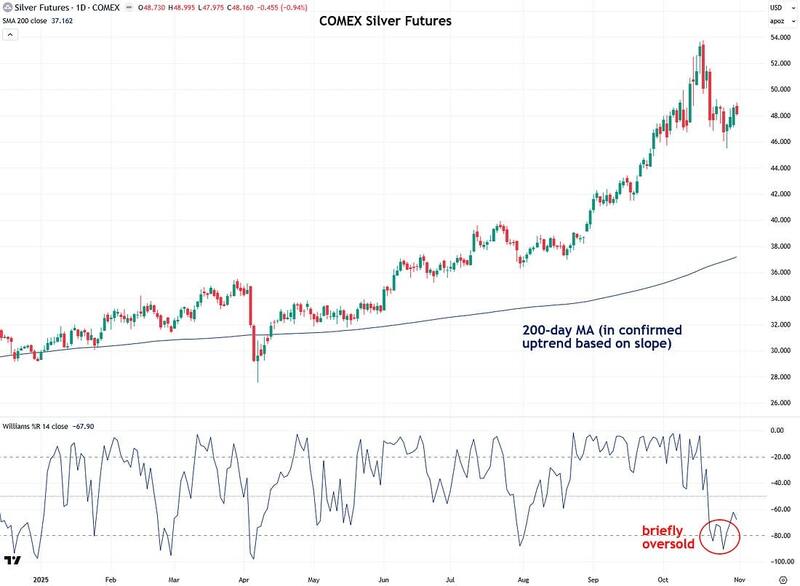
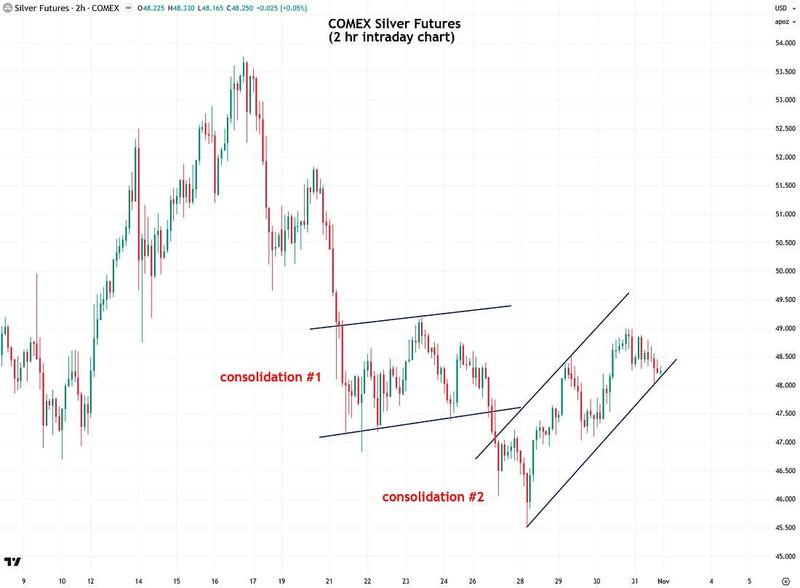
A look at silver’s 2-hour intraday chart shows that it, like gold, is now forming its second consolidation pattern, and how that resolves will provide a strong indication of whether the recent pullback is over or if it still has a bit further to go.
Similar to gold near its key $4,000 level, silver’s price action is occurring just below the key $50 level, which isn’t surprising since there are usually a lot of algo games played around major levels that so many eyes are watching.
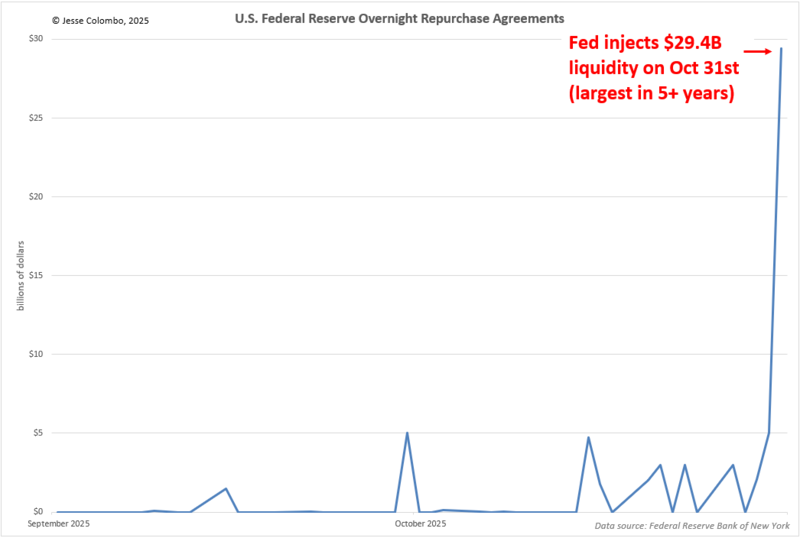
Also, I want to point out something very relevant to the discussion of whether the precious metals pullback is over, and that is a highly unusual and alarming occurrence on Friday, when overnight repo demand spiked to $29.4 billion, the highest daily level in more than five years. Repos are short-term loans the Fed extends to banks when they need immediate liquidity.
When this number jumps sharply, it is not a normal occurrence, as it signals that strain is building behind the scenes in short-term funding markets. This kind of stress could ultimately set the stage for renewed asset purchases in the form of quantitative easing (QE), which would be highly bullish for precious metals and could easily provide the fuel to send gold to $5,000+ and silver to $80+.
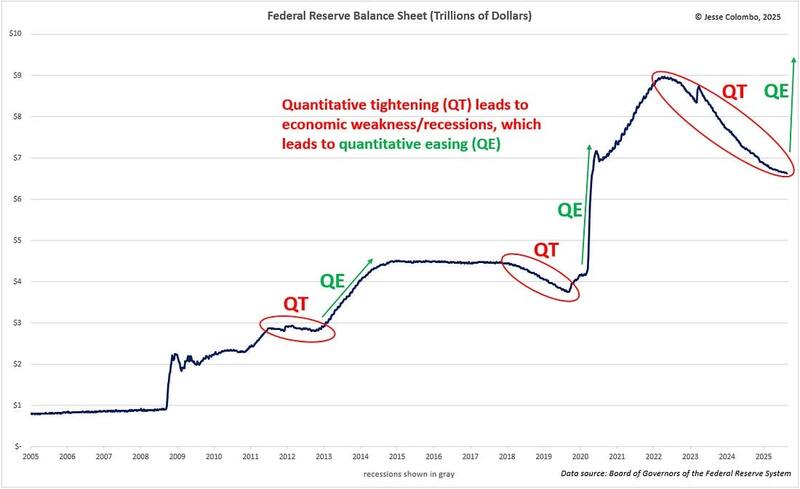
A return to quantitative easing (QE), which is essentially digital money printing, is only a matter of time. No government or central bank can resist using the printing press for very long if they have access to it, and that is the ultimate reason for owning precious metals.
The Fed’s quantitative tightening (QT), or shrinking of its balance sheet, since 2022 has set the stage for the growing financial stress now emerging, which is reminiscent of what occurred in late 2019 and ultimately led to massive QE that was officially attributed to the COVID pandemic.
Notably, at last week’s meeting, the Fed announced it is ending the drawdown of its still-substantial balance sheet, citing signs that money market liquidity conditions are tightening and bank reserve levels are falling.
To wrap up, precious metals are now oversold, which would typically set the stage for a rebound given the strong uptrend they remain in.
However, I am waiting for one more thing to resolve, which is the intraday consolidation patterns currently forming in both gold and silver. How those patterns play out will also have a strong influence on the direction of mining stocks and the platinum group metals.
Another important factor to keep in mind, which may contribute to a rebound from here, is the alarming stress building in the financial system that is likely to eventually lead to another wave of digital money printing. As always, I’ll keep you updated on how this all plays out and what I’m seeing.
More By This Author:
Precious Metals Are Officially OversoldWhy Precious Metals Are So Volatile Right Now
How To Know When The Precious Metals Pullback Is Over
For the author's full disclosure policy, click here.


