
Statistics through 2022Q2 – rapid growth in natural gas exports but from small base. LNG exports contribution to change in goods exports quantitatively trivial.
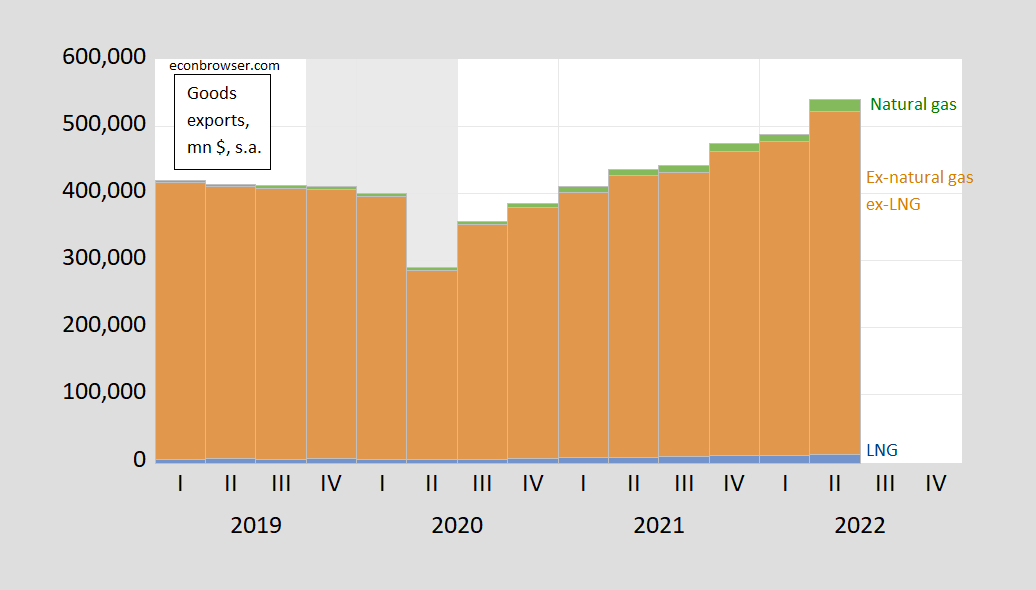
Figure 1: Non-natural gas, non-LNG exports (tan bar), natural gas exports (green bar) and LNG exports (blue bar), all in millions $, quarterly rate, seasonally adjusted. NBER defined peak-to-trough recession dates shaded gray. Source: BEA, NBER, and author’s calculations.
And here is the contribution to changes in goods exports (q/q, millions $, seasonally adjusted):
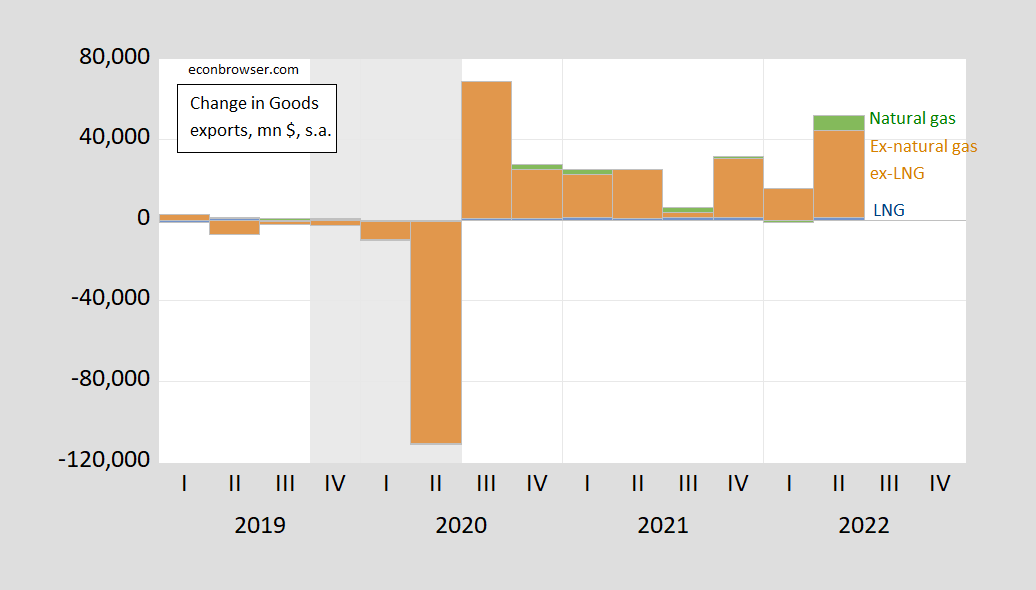
Figure 2: Quarter-on-quarter change in non-natural gas, non-LNG exports (tan bar), change in natural gas exports (green bar), and change in LNG exports (blue bar), all in millions $, quarterly rate, seasonally adjusted. NBER defined peak-to-trough recession dates shaded gray. Source: BEA, NBER, and author’s calculations.
More By This Author:
Liquified Natural Gas' Contribution to Goods Exports (Balance of Payments Basis)
How Long The Dollar Upswing?
The External Environment and Prospects for GDP Growth


Comments
Log in or sign up to join the conversation.