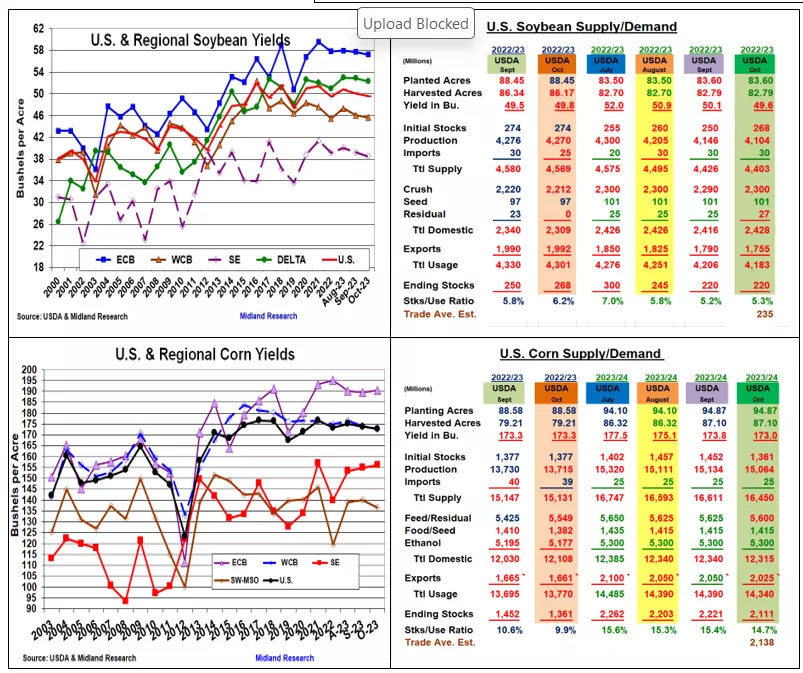
Lower Soybean & Corn Yields Reduce US Ending Stocks

Image Source: Pixabay
Market Analysis
This month’s US soybean and corn production & ending stocks were near the low side of expectations & down from September. This prompted a bullish short-covering price reaction in both pits. Despite higher US wheat ending stocks, this food grain followed the other pits higher as the USDA reduced its world output & kept its world stocks at 8-year lows.
October’s US soybean crop dropped 42 million to 4.104 billion bu when USDA lowered the US yield to 49.6 bu, only 0.1 bu from the bottom of the trade’s yield range. Interestingly, NASS lowered all four US regions’ yield with the W & E Mid- west output dropping 30 million bu of the total decline. In the past, two monthly US row crop yield declines were an omen about a further lower US yield. Beans’ smaller crop & 10 million increase in US crush to 2.3 billion bu prompted the USDA to slice its 23/24 exports by 35 million bu. This kept 2024 stocks unchanged at 220 million bu. Internationally, the USDA left S America’s crops unchanged, but their 2 mmt lower initial stocks & 1 mmt drop in US output were behind October’s 3.6 mmt smaller world stocks.
The USDA’s 70 million lower US corn crop at 15.064 billion & 173 bu US average yield were both below the trade’s expectations. The four major US regions’ yields were mixed. The WCB (-1.5) & SW/Delta (-3.4 Bu) were lower while the ECB (+1.2) & SE (+1.2 bu) had higher yields. October’s smaller output & lower beginning stocks cut US corn supplies by 161 million bu. Interestingly, the World Board decreased both corn’s new-crop feed & export demand by 25 million bu. Overall, corn’s 23/24 stocks decline by 110 million to 2.111 billion bu and they were still 27 million below the trade’s estimate.
Last month’s Small Grain report advanced the US wheat crop by 78 million bu and imports were up by 5 million increasing the US’s supplies. Even with a 30 million increase in US feed demand, October’s US stocks rose by 55 million to 670 million. However, the USDA sliced 1.5 mmt from Australia, 2 mmt from Kazakhstan & 0.5 mmt from Brazil’s crops to lower the world’s output by 4 mmt this month. This kept world stocks at their lowest level since the 2015/15 crop year.

What’s Ahead:
This month’s lower-than-expected US crops, an ECB weekend rain event slowing 2023’s harvest & tight producer selling at current values combined for a dramatic short-covering rally in CBOT prices. Overhead tech resistance at $13.00 and $5.00 exists, but harvest issues & yield reports could advance soybean & corn prices to their next resistances $1.00 & 40-50 cents higher. Hold sales.
More By This Author:
After Stock Changes, US Corn And Bean Yields Are Next Market Factors
Larger US Wheat Output & Soybean Stocks Pressured CBOT Prices
USDA's Quarterly Stocks and Small Grains Report
Disclaimer: The information contained in this report reflects the opinion of the author and should not be interpreted in any way to represent the thoughts of any futures brokerage firm or its ...
more


