
Is Silver About To Crash Like In 1980 And 2011?

Image Source: Pixabay
With silver rallying strongly and rising more than 50% since the start of the year, a growing number of investors are starting to worry that a crash may be coming, similar to what happened after the major spikes in 1980 and 2011, instead of focusing on the incredible long-term opportunity that remains in front of us.
But as one of the few analysts who correctly identified the bull market in both silver and gold from the very beginning, I have consistently urged investors to stop dwelling on negative scenarios and instead recognize the tremendous upside that still lies ahead.
This is silver’s moment to shine, and it is also a moment of vindication for those of us who believed in it all along, even when it was ignored by the mainstream financial world and left for dead as recently as just a few months ago.
I believe silver will not repeat the sharp collapses that followed its short-lived surges in 1980 and 2011. This time is different. This is a legitimate, sustainable bull market with real staying power and the potential for lasting gains.
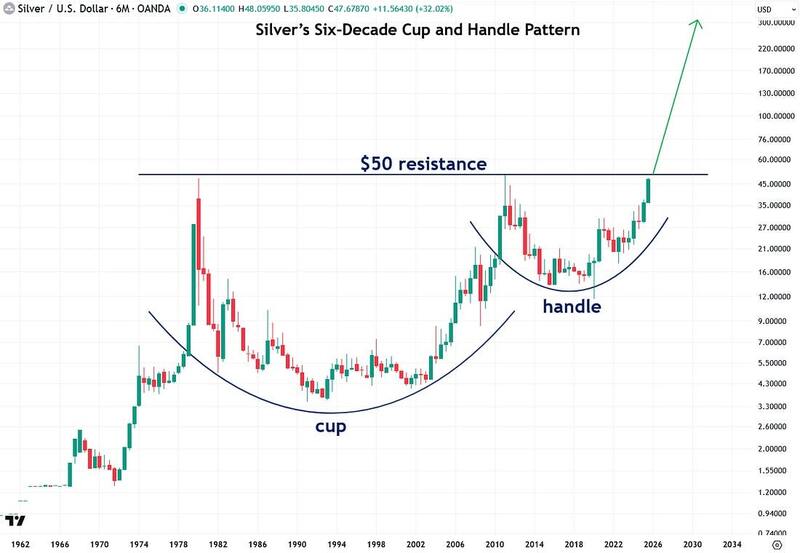
To start, I want to show you the long-term chart of silver going back six decades to the 1960s. You’ll notice that there have been three major price surges.
The first was the Hunt Brothers–driven spike in 1980, followed by the quantitative easing–fueled rally in 2011, and now the current precious metals bull market. I believe this current move is a legitimate and sustainable bull market that is here to stay, as I will explain throughout this piece.
Now I want you to notice that in both 1980 and 2011, silver surged toward the $50 an ounce level, but that is where those rallies failed and quickly reversed. As a result, the $50 level became a critical price ceiling and resistance level, and it still is to this very day.
For the past two years, as I have been calling for a silver bull market, even when silver was still in the $20 range, I consistently pointed to the $50 level as the key one to watch. I believed it would act like a magnet and draw the price of silver toward it, since major psychological levels often have that effect. And sure enough, silver has steadily climbed toward that level, just as I expected.
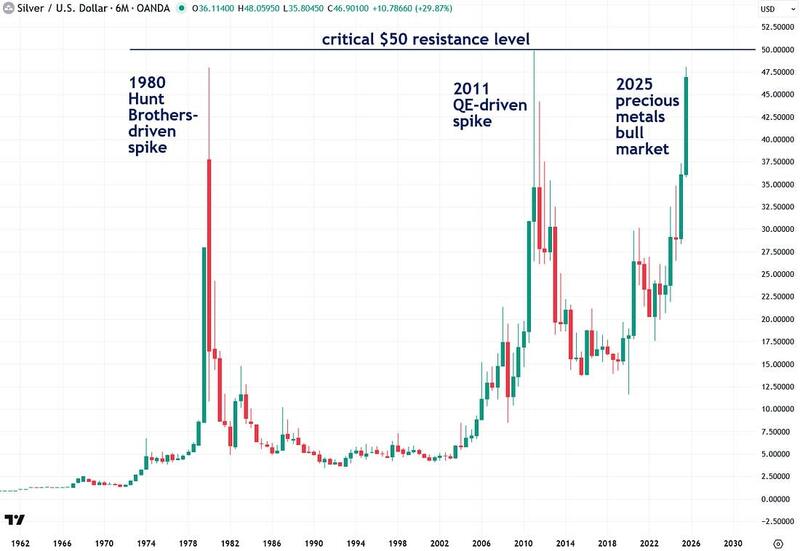
Now, with silver trading around $47 to $48 at the time of writing, it is extremely close to breaking through the key $50 level, which is a major make-or-break point.
I also want to point out that many investors bought significant amounts of both silver bullion and ETFs during the frenzy of 2011. Unfortunately, when the price plunged afterward, they were left holding the bag, and many have been sitting on losses for the past 14 years.
But once silver finally surpasses $50, which will mark a new all-time high, no silver investor will be sitting on a loss, at least in nominal terms. That fact alone makes the $50 level a critical psychological barrier that will trigger a surge in investor sentiment once silver breaks above it.
Until recently, many silver investors remained deeply discouraged by years of losses and underperformance. But a decisive break above $50 will mark the beginning of an entirely new era for silver and will set off a powerful virtuous cycle.
Many more investors will pile in, including new and younger participants who never considered silver before and who are not burdened by the baggage carried by older, battle-scarred veterans. This explosion of interest will help drive silver to incredible new heights.
Now I want to say that I adamantly believe silver is going to surpass $50 and go much higher from there in the near future. However, there is something I want to point out. Because silver has surged so strongly and so quickly, it is a bit extended in the short term, which makes it likely that it will consolidate or pause before eventually breaking through $50.
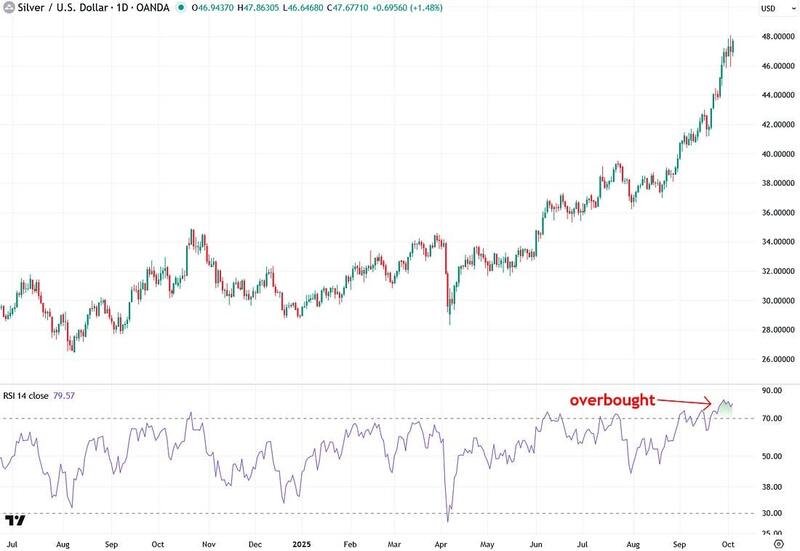
Evidence of this can be seen in the Relative Strength Index (RSI) momentum indicator, shown in the chart below, which provides overbought or oversold readings for assets. I respect what it indicates.
That being said, unlike many amateur investors and analysts, I am adamant that an overbought reading like the current one in silver is not an automatic signal to sell or an indication that the bull market is over.
There is a very high likelihood that silver will experience a shallow pullback or move sideways for a time to work off its overbought condition. This would conserve energy for the next leg higher, when silver smashes through the $50 ceiling.
In April, I called on the very day that gold was likely to consolidate temporarily, but not crash. Sure enough, that is exactly what played out in the following months, setting gold up for the impressive rally it is experiencing today.
I believe a similar scenario is likely to play out in silver. And honestly, I welcome that because I would rather see silver rise in an orderly, more sustainable way than risk burning itself out. Plus, I would like to accumulate more of everything, including silver bullion, mining stocks, and more! And I’m sure you do too.
Now I want to get to the part of this report where I explain why the current bull market in silver is very different from the ones that failed in 1980 and 2011.
The first point I want to make is that while $50 is a key nominal and psychological price ceiling to watch, and I believe silver will break through it decisively, even if it pauses first to work off its overbought condition, it is important to consider how much inflation has occurred over the past several decades.
In real terms, the price of silver remains much lower than those previous peaks. That means $50 in 1980 or 2011 is certainly not the same as $50 in 2025, as anyone who has recently been to the grocery store can easily understand.
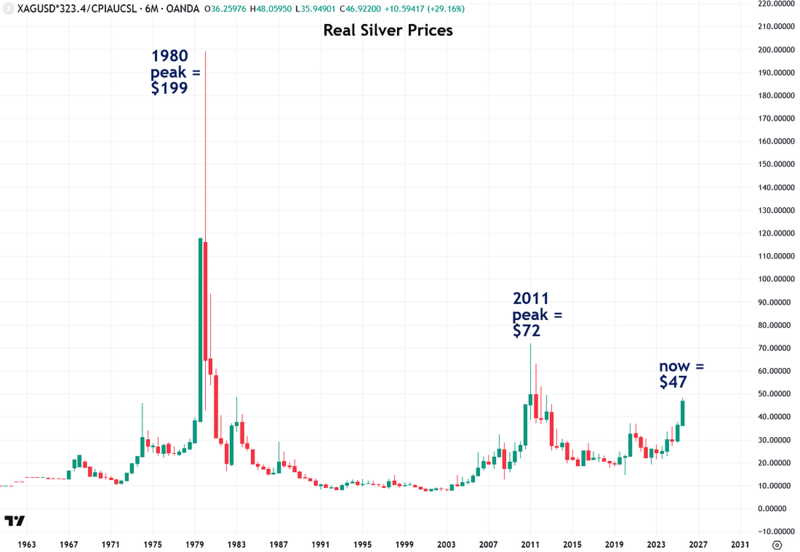
To illustrate that point, I created a chart showing the real, or inflation-adjusted, price of silver over the past six decades. On the chart, I highlighted what the $50 silver peaks in 1980 and 2011 would be worth in 2025 dollars. It turns out that in 1980, silver reached the equivalent of $199, and in 2011, it reached the equivalent of $72!
Now compare that to today, with silver trading around $47, which is much lower than either of those past peaks.
For that reason alone, not even including the additional points I will explain next, I believe the current silver bull market is sustainable, has much more room to run, and should be able to finally smash through the $50 ceiling that has held it back for so long.
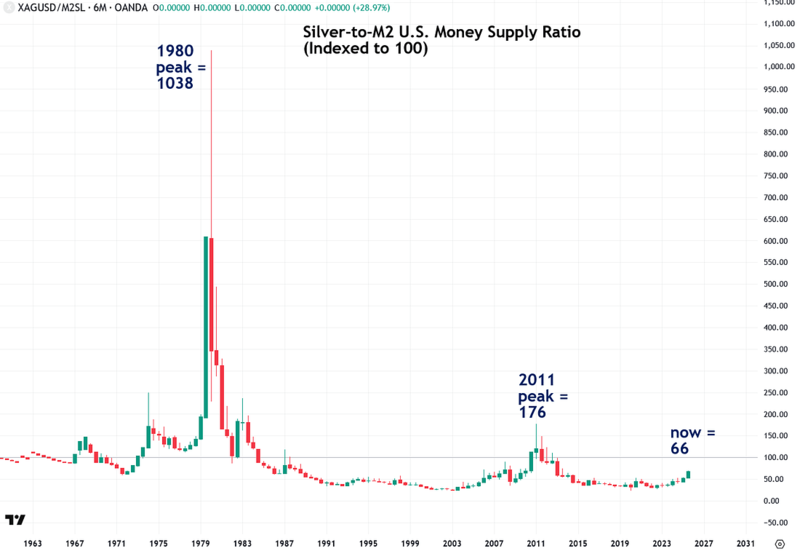
To further reinforce my point above, I also want to show you the ratio of silver to the U.S. M2 money supply, indexed to 100. This may be an even more accurate measure of inflation than the Consumer Price Index (CPI) used to create the previous chart. After all, the root cause of inflation is growth in the money supply itself. As Milton Friedman, the Nobel Prize–winning economist, famously said, “Inflation is always and everywhere a monetary phenomenon.”
Similar to what the real silver price chart revealed, this chart shows that although silver is approaching the same nominal price of $50, its real-world price is much lower than it was in 1980 and 2011.
For example, in 1980 the ratio was 1,038, in 2011 it was 176, and now it is just 66. I see this as clear evidence that, despite its recent gains, silver’s bull market is nowhere near being long in the tooth. It still has substantial room to rise, and it should be able to blow through the $50 level with ease.
Next, let’s move on to another metric that confirms that silver is still much cheaper today than it was at the peaks in 1980 and 2011, despite its recent gains.
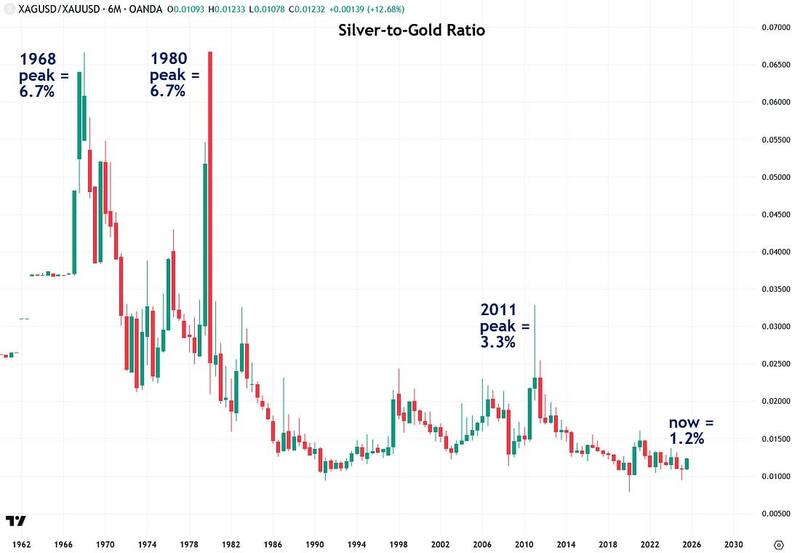
This time, we will look at the silver-to-gold ratio, which is a useful way to determine whether silver is undervalued or overvalued relative to gold, the leading benchmark in the precious metals market.
While gold has always been more expensive than silver throughout history, the gap between them has varied significantly. At the 1980 peak, silver was 6.7% of the price of gold. At the 2011 peak, it was 3.3%. But now, silver is just 1.2% of gold’s price, which is far below historical levels.
This indicates that silver is extremely cheap by historical standards and still has substantial room for its bull market to continue. And based on the duration of past precious metals bull markets, I believe silver still has at least another decade to run, and the same goes for gold.
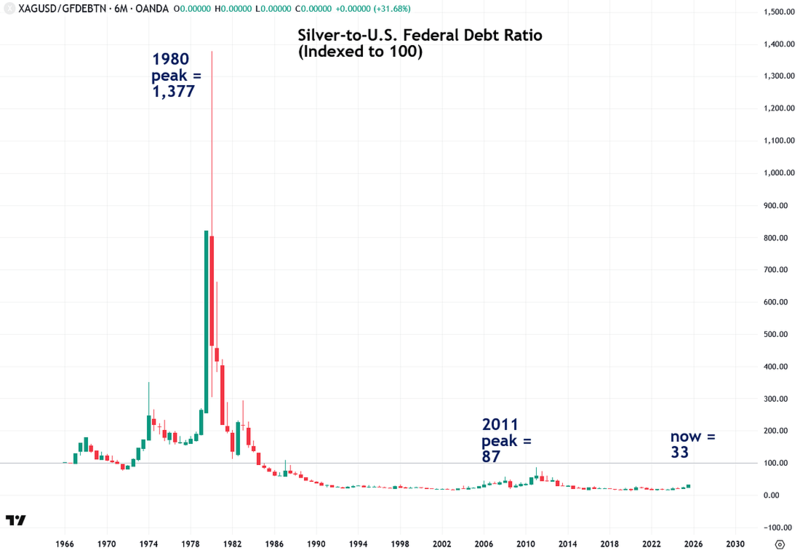
Another eye-opening metric that confirms silver is still extremely cheap is the ratio of silver to the U.S. federal debt, which now stands at $37.8 trillion and is growing at an alarming pace of $1 trillion every 100 days with no signs of slowing.
This is an important metric because it shows whether the price of silver has kept pace with the growth of the national debt, and the answer is clearly no.
The chart, indexed to 100, shows that this ratio was 1,377 at the 1980 peak, 87 at the 2011 peak, and only 33 today. This indicates that silver has substantial room to catch up to the expanding national debt. In that context, $50 silver is not expensive by any measure, and a move to $100 or more is far from inconceivable.
Another reason why this ratio is so important is that the higher the federal debt rises relative to GDP, the closer we move to the inevitable breaking point where the government and the Federal Reserve will be forced to support the U.S. Treasury market and fund government operations by running the printing presses on overdrive.
This will send inflation through the roof and ultimately destroy the dollar, causing gold and silver to reach prices that are difficult to even comprehend.
This will not be ordinary inflation, but full-blown hyperinflation like what my great-grandparents suffered through in Weimar Germany during the 1920s. It devastated the wealth and economy of Germany and was the reason they emigrated to the United States. Unfortunately, it also led to mass radicalization, which directly paved the way for the rise of Hitler.
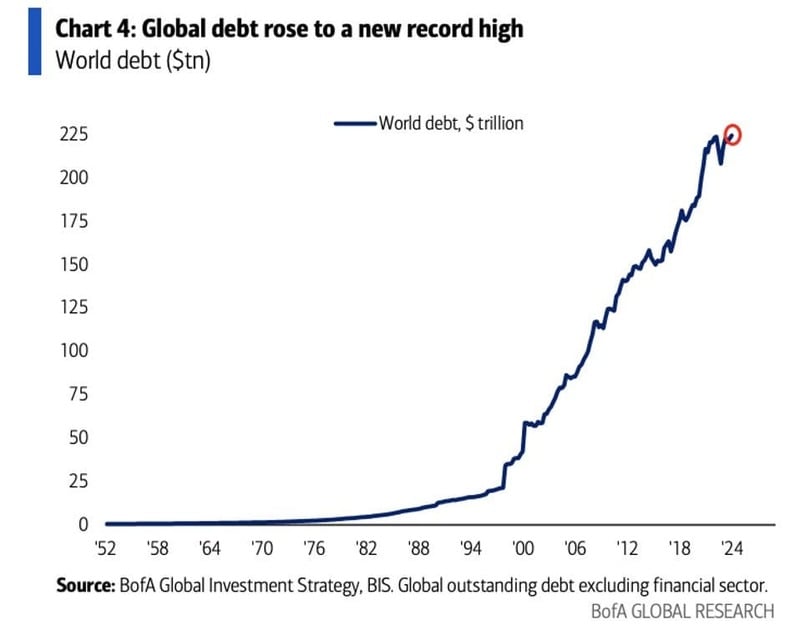
Unfortunately, this debt problem is truly a worldwide phenomenon, as global debt has surged more than tenfold since the mid-1990s, reaching an estimated $250 trillion. This towering debt burden is a ticking time bomb that will ultimately bring fiat currencies to their knees.
That is why it is of the utmost importance for everyone to acquire at least some physical gold and silver to protect themselves against what lies ahead. This fact alone guarantees that precious metals still have much further to rise.
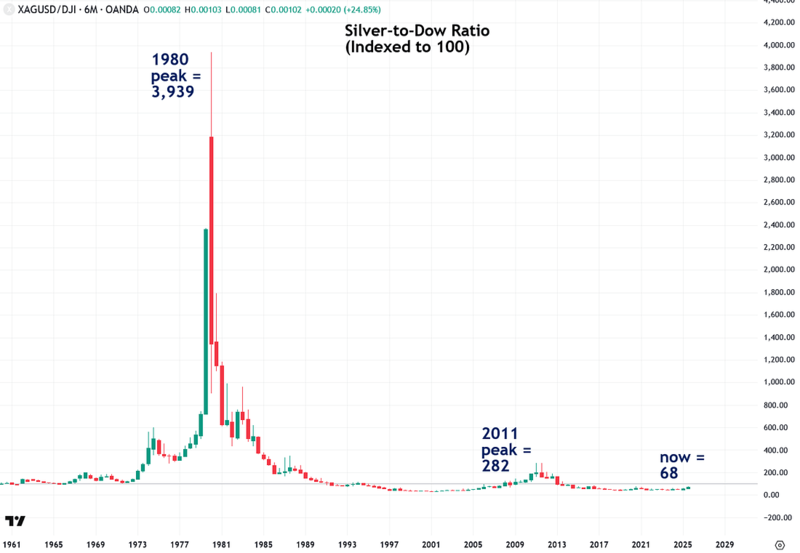
Another useful way to determine whether silver is cheap or expensive compared to its past is to measure it against another yardstick: the Dow Jones Industrial Average.
This comparison is valuable because there is a long-established relationship between precious metals and stocks, with capital rotating back and forth between them in secular phases. In many ways, they act as counterbalances to each other.
The chart of the silver-to-Dow ratio, indexed to 100, shows that silver at its 1980 peak reached an astounding 3,939. At the 2011 peak, it was 282. Today, it is only 68. This confirms that silver remains very cheap and that $50 is no longer a particularly high price.
The reason for this extremely low ratio is twofold: the U.S. stock market is highly inflated and expensive right now, while silver remains undervalued by nearly every metric.
I believe this situation will reverse, with silver far outperforming as stocks decline and their lofty valuations return to more realistic levels. That reversal will benefit precious metals enormously, as trillions of dollars flow out of a sinking stock market and into a booming silver and gold market, sending them dramatically higher.
As we wrap up this report, I want to leave you on an extremely exciting note. Silver has been forming a powerful chart pattern known as a cup and handle for the past six decades. This pattern indicates that once silver breaks out, it will almost certainly soar to at least several hundred dollars an ounce.
I believe a reasonable target is between $300 and $500, and that does not even factor in the inevitability of hyperinflation, which will send silver to prices measured not just in hundreds, but in billions and even trillions of dollars per ounce.
So this brings us back to the critical $50 threshold that I have discussed throughout this report.
In order to confirm the cup and handle pattern and the extremely bullish scenario, silver must decisively close above that level.
As I said earlier, that will be a game changer for investor sentiment toward silver, because once it happens, nobody who has ever bought will be holding at a loss.
The story will shift from years of frustration to stories of incredible fortunes made, the kind of life-changing, generational wealth that investors dream of. I am excited and waiting for that breakout, but silver may pause for a period of time to catch its breath first, and I actually hope it does because I want to make a few more purchases before it takes off for good.
So in conclusion, I have made the case throughout this report that while silver’s rallies in 1980 and 2011 were short-lived spikes that ended in spectacular crashes and left investors discouraged for decades, the current move is very different.
This time, silver is in a sustainable and organic bull market in which prices will rise significantly and remain at those high levels permanently.
One of the key reasons that outcome will happen is because silver today is much cheaper than it was in 1980 and 2011, when measured against multiple benchmarks, including inflation, the money supply, gold, the U.S. national debt, and the stock market.
These are extremely exciting and promising times for precious metals investors, and I am grateful to have you on this journey with me. I hope you prosper greatly in the years ahead.
More By This Author:
The Bullish Case For Palladium
Gold Isn't Going Up, Your Money's Just Losing Value
The Bullish Case For Platinum
For the author's full disclosure policy, click here.


