
As we approach today’s delayed CPI report, it’s helpful to look beyond government statistics to focus on a more current and robust picture of inflation.
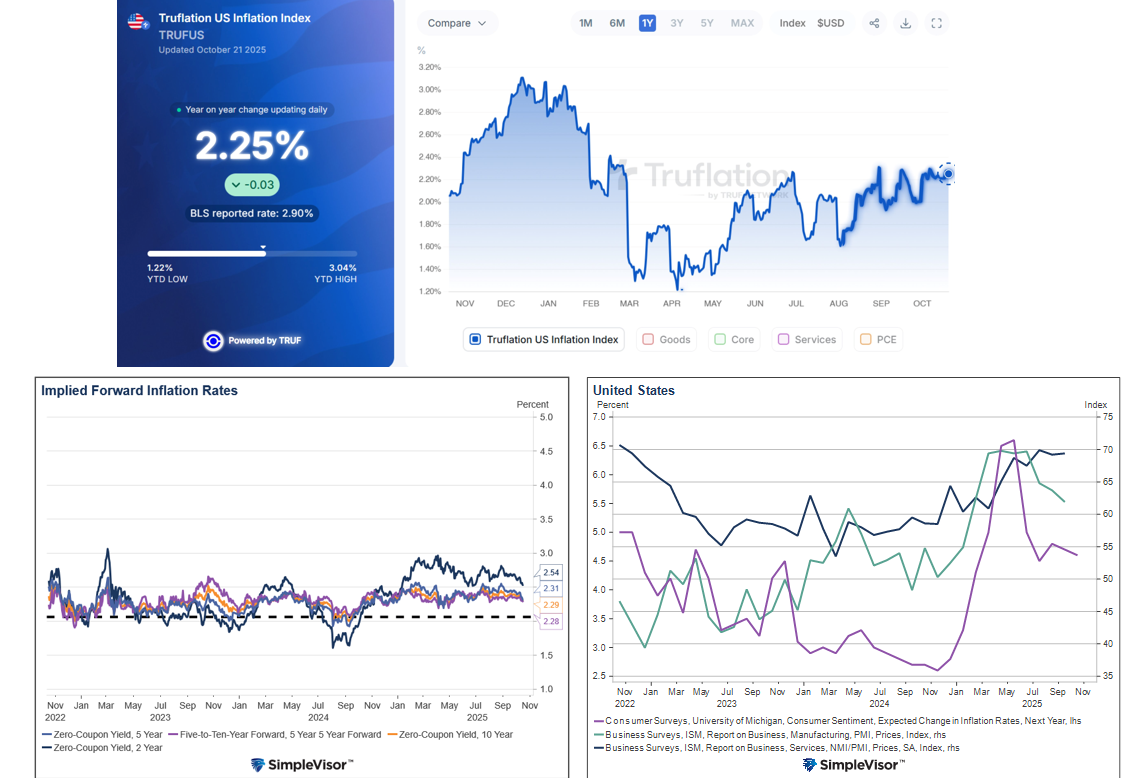
Implied Inflation: This is derived from comparing the yields of nominal Treasury securities to Treasury Inflation-Protected Securities (TIPS). The graph below (bottom left) shows that implied inflation, also known as break-evens, has been gently declining. The shortest measure of inflation expectations, the 2-year break-even, has fallen from nearly 3% at the start of the year to 2.50% today. The market doesn’t seem overly concerned with tariffs generating inflation.
Truflation: This independent organization uses over 30 million data points to compute its real-time inflation index. For comparison, the BLS uses about 80,000 items in its CPI report. Per the top graphic below, Truflation’s measure has waffled between 2.00% and 2.25% for the last few months. This leaves us to believe that inflation has not upticked significantly since April, as many feared.
Surveys: ISM services and manufacturing gauges (bottom right green/black lines) of price changes have stabilized at high levels due to anticipated tariff-related inflation. The indicator measures how many respondents think inflation is rising versus falling. It doesn’t try to quantify a perceived inflation rate. Conversely, the University of Michigan Survey (bottom right- purple) asks consumers where they think inflation will be a year from now. After peaking at 6.5% on tariff concerns, it has fallen to 4.5%. Sentiment regarding inflation remains high. The risk is that consumers and corporate behaviors might stoke inflation if they believe it will increase.
It’s worth noting that implied inflation and Truflation tend to be much better predictors of inflation than the surveys.
What To Watch Today
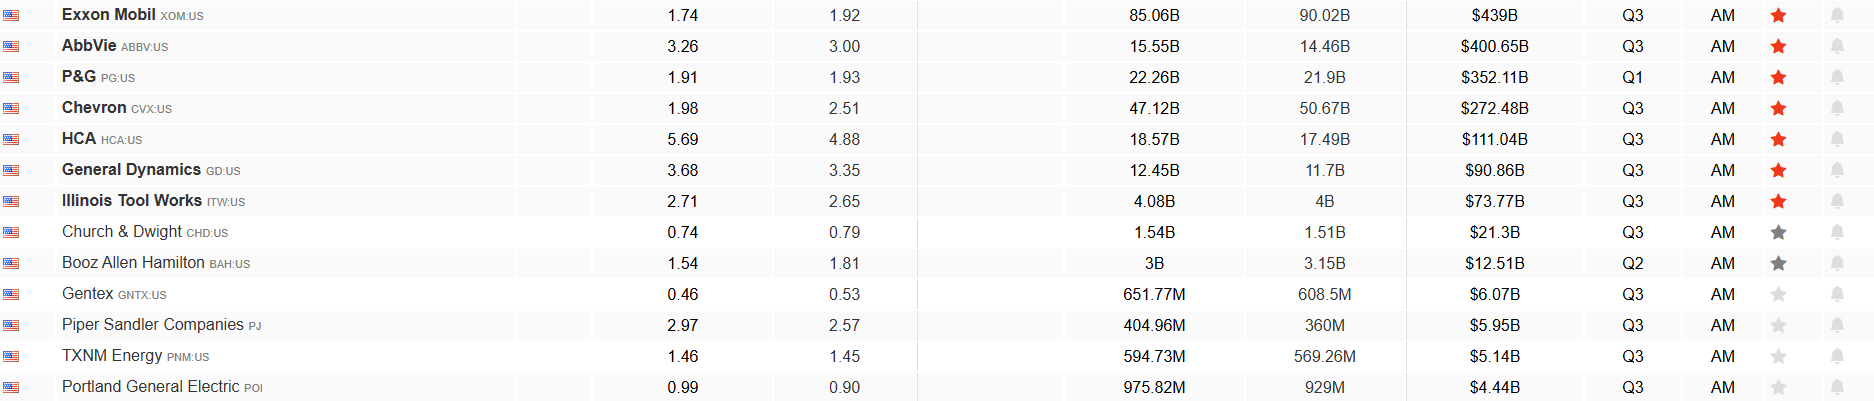
Earnings
(Click on image to enlarge)
Economy
(Click on image to enlarge)

Market Trading Update
Yesterday, we discussed that the market has held the 20-DMA but is wrestling with breaking the bullish trend from the “Liberation Day” lows. Overall, the bullish backdrop remains, suggesting that investors remain allocated to the market for now as we gear up for the last two months of the year. The big news yesterday, however, was the surge in oil prices following the Trump administration’s new sanctions on Russia. However, like tariffs, this use of sanctions is likely the same “stick and carrot” scheme to get movement on a peace accord between Russia and Ukraine. Nonetheless, the surge in oil prices helped lift the energy sector, which has struggled for much of this year.
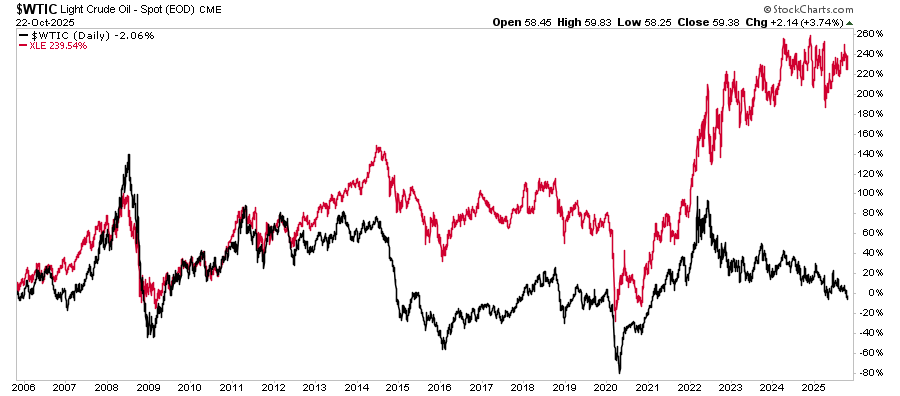
One notable issue, however, is the divergence of energy stocks from the underly commodity. As shown in the chart below, historically, there has been a very high correlation between the change in oil prices and the performance of energy stocks. This correlation makes sense as the revenue of energy companies is directly tied to the cost of oil. The correlation between the turn of the century and 2013 was near perfect. Then, as the Federal Reserve dropped rates to zero and launched a third round of Quantitative easing, energy stocks surged away from oil prices. However, when oil prices collapsed in 2014, the correlation returned and stayed elevated until 2020. Since the pandemic lows of 2020, energy stocks have completely detached from the underlying commodity as speculative investment has surged in the overall market. Given the detachment of energy stocks from the underlying commodity and the subsequent flow of revenue, investors should question whether this gap is sustainable.
(Click on image to enlarge)
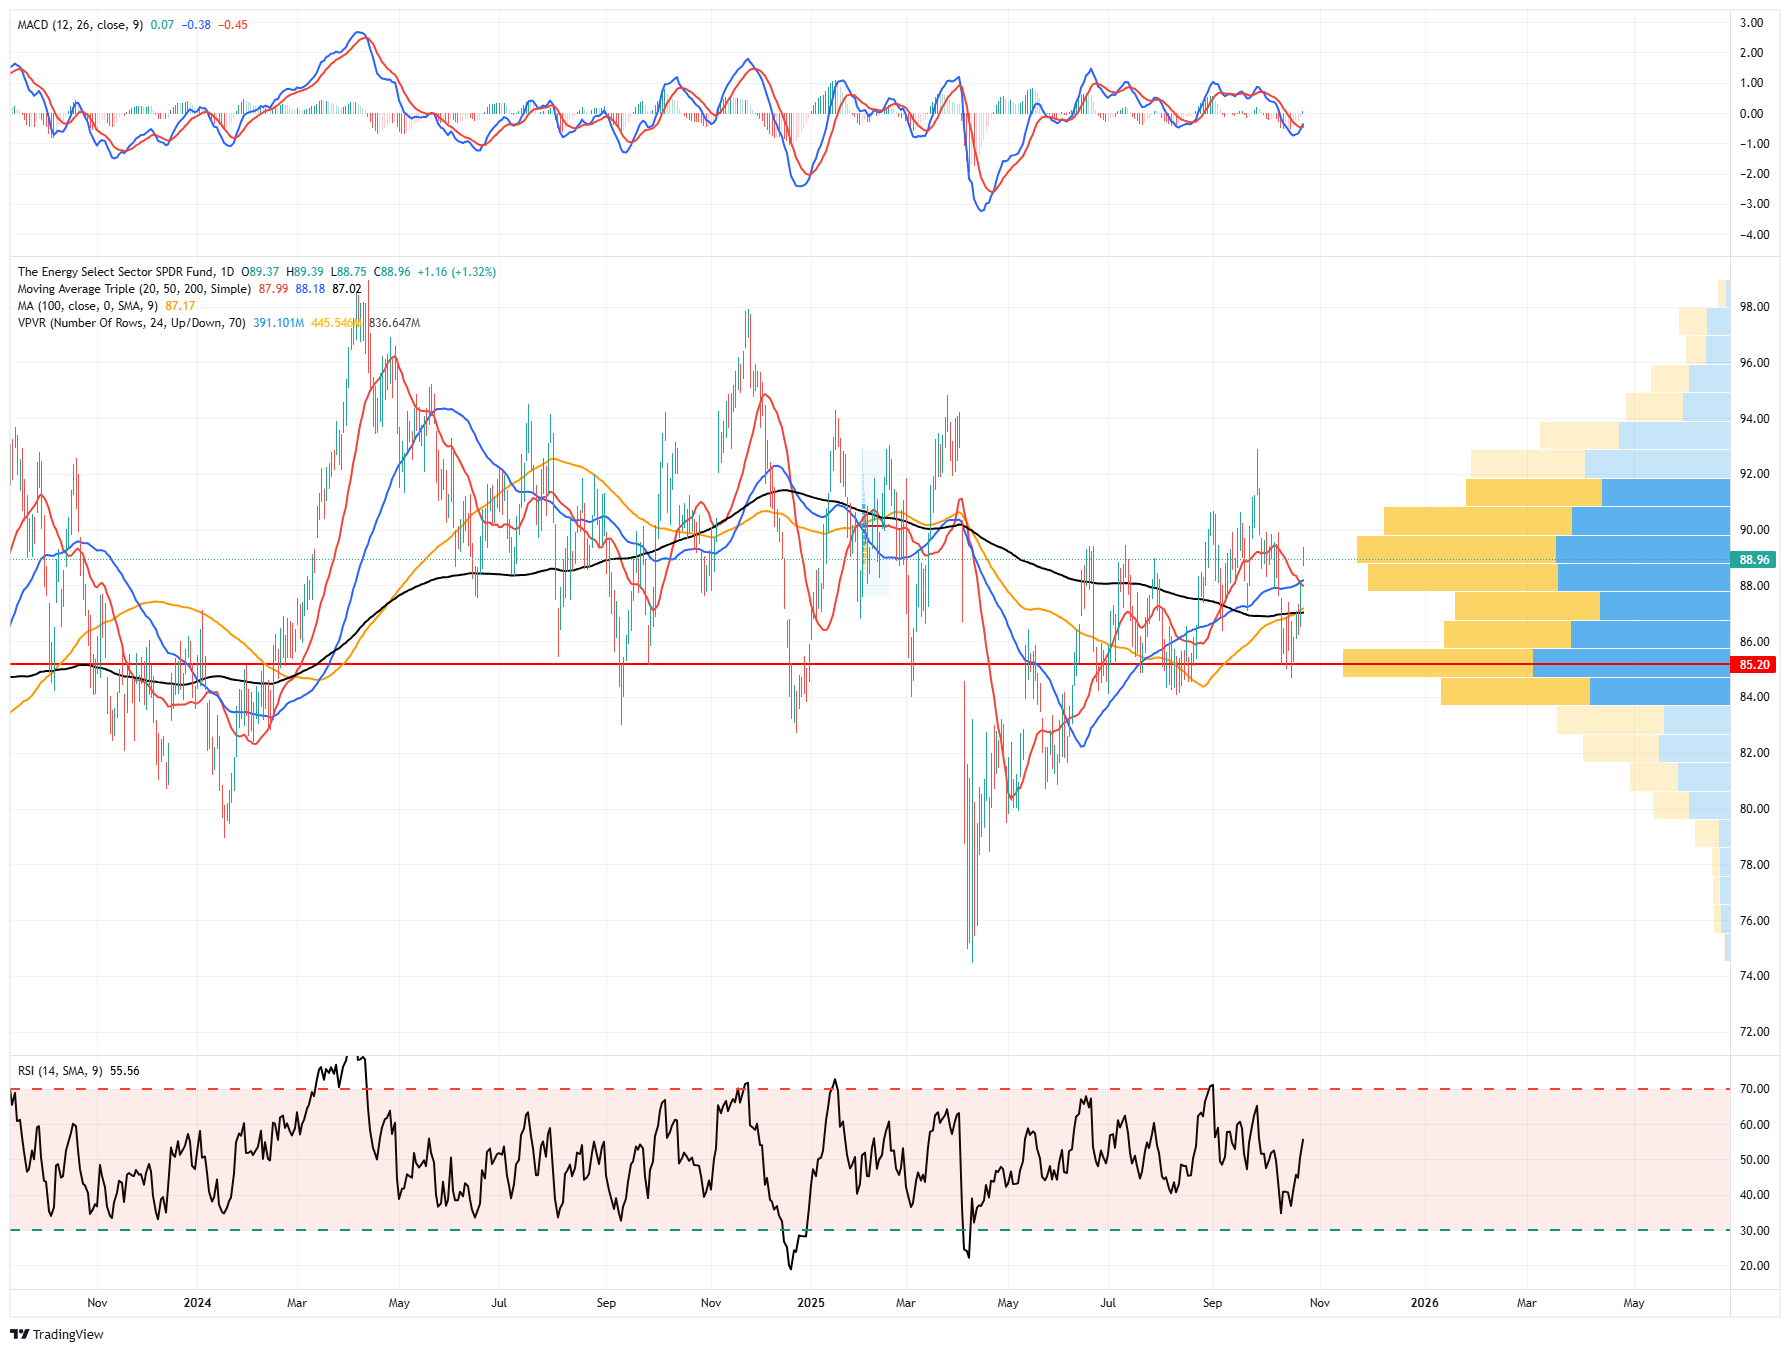
The energy sector, as represented by XLE, remains very range-bound in the short term. At current prices, you will notice an enormous number of buyers and sellers keeping XLE within the current range. However, with the MACD turning on a “buy signal” and the sector not overbought as of yet, there is a possibility we could see both oil prices and energy stocks increase in price. You will also notice that the rising trend in oil is starting to threaten the downward price trend from last year. A breakout could precede a sharp move higher.
(Click on image to enlarge)
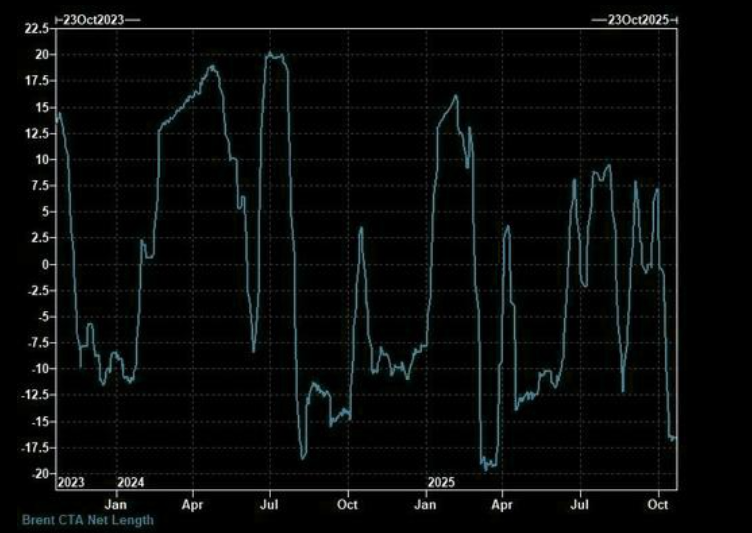
There are two things about oil prices currently. The first is that oil is a “dollar traded” asset, which blows a massive hole in the “dedollarization” claim. As foreign investors buy oil, they have to convert to U.S. dollars to do so. Secondly, one of the potential catalysts of a sharper rally in oil is the massive short position against the dollar. If oil prices keep rising, and CTAs are forced to cover shorts, the forced buying could push oil prices decently higher in the near term.
Lastly, while energy (as represented by XLE) is not THE most oversold on an absolute return basis like healthcare, energy stocks likely provide a much better risk/return profile than healthcare or technology, which are very overbought.
(Click on image to enlarge)

The massive rally in oil prices yesterday is worth watching to see if it develops into an advantage for those bullish on the energy sector.
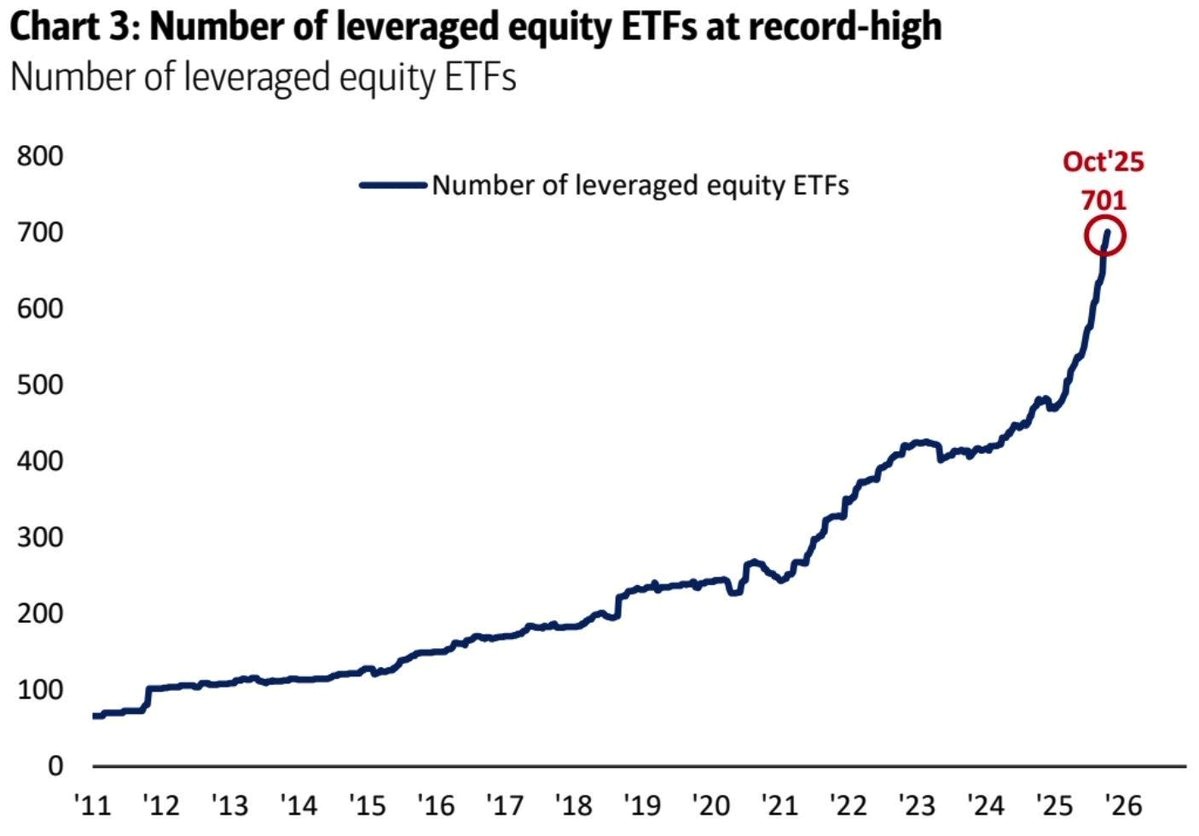
Leveraged ETFs Are Growing Rapidly
Not only are some investors chasing the most speculative of stocks and other assets, but they are also employing record amounts of leverage to do so. The graph below, courtesy of BofA, shows that there are now over 700 leveraged ETFs. Most of these ETFs give their investors 2x or 3x the daily returns on an underlying index or individual stock. Some go as high as 5%.
Leveraged ETFs reset daily. Which means the funds must buy or sell the underlying index to stay balanced. Further, the leverage combined with the daily resets means that returns of the leveraged ETFs versus the underlying assets drift over time, especially in high volatility environments. The increased leverage is not just a risk to those using the leverage, but it’s a broad market risk as well. For instance, these funds have to chase the market. When the market is upward trending, leveraged ETF managers are forced buyers, thus accentuating gains. The opposite holds true in down markets. However, in a disorderly decline, the undue selling pressure can cause pockets of steep declines. A one-off example occurred in the cryptocurrency market on October 11th, as we documented in our Commentary, The AltCoin Liquidity Bloodbath.
While the proliferation of leveraged ETFs is relatively new, Wall Street has a long history of creating complex leveraged products, which tend to allow more access to risk and leverage. For some astute traders, leveraged ETFs and other forms of leverage can be very profitable. However, as history has shown time and time again, retail traders ultimately pay the price by getting caught chasing markets when they peak.
Tweet of the Day

More By This Author:
Beyond Meat Surges: Another Meme Ponzi?Leveraged ETFs: Yet Another Sign Of Rampant Speculation
Joe Weisenthal’s Take Down Of The ‘Debasement’ Trade


Comments
Log in or sign up to join the conversation.