
Last Friday, the cryptocurrency market experienced a violent crash. The trigger was President Trump’s announcement of a 100% additional tariff on Chinese imports. The sudden and unexpected action reignited fears of a full-blown trade war. Global risk assets fell sharply. Of these, the most notable declines occurred in the cryptocurrency markets, particularly the altcoin market.
Altcoins, short for “alternative coins,” are cryptocurrencies other than Bitcoin. Altcoins are often built on their own blockchains or as tokens on existing platforms. Some examples of the popular altcoins include Ethereum (ETH-X), Solana (SOL-X), Ripple (XRP-X), and Dogecoin (DOGE-X). Altcoins typically aim to offer different features, such as faster transactions, smart-contract capabilities, niche applications like decentralized finance (DeFi) or privacy. Altcoins are more volatile and speculative than Bitcoin due to lower market caps, reduced trading volume, and greater sensitivity to market sentiment. It is estimated that over 10,000 altcoins exist, with many trading on centralized exchanges like Binance or decentralized platforms.
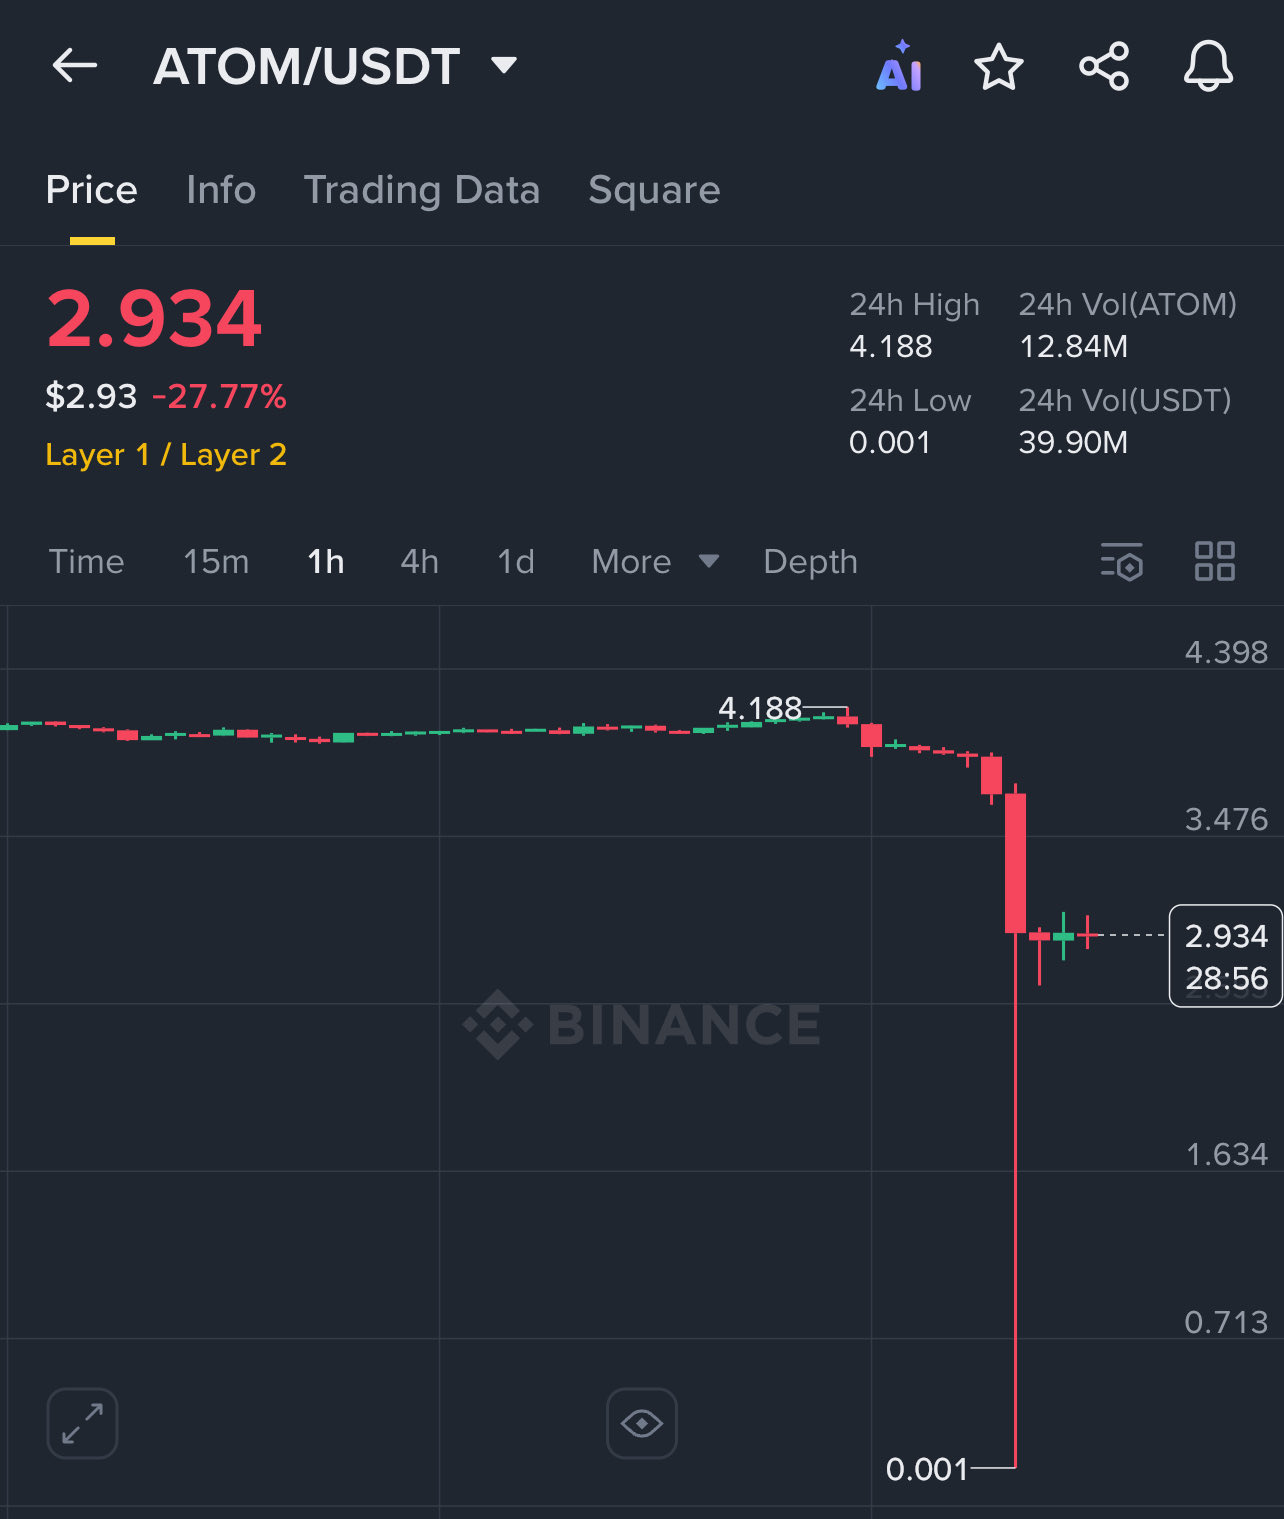
The news of 100% tariffs on China fell late in the afternoon on Friday, when liquidity in most markets is typically lacking. Bitcoin dropped by 17%, from peak to trough, on the news. Major altcoin tokens were hit harder. For instance, consider the following peak-to-trough declines:
- Ethereum -23%
- Ripple -60%
- Solana -38%
- Dogecoin -64%
Smaller coins like Cosmos (ATOM), shown below, collapsed to near zero. It is believed that over $20 billion in crypto positions were liquidated due to margin calls. In the process of forced margin liquidations, centralized exchanges amplified the selling through auto-liquidation mechanisms. While the altcoin market is relatively small, it does leave us with an important question: Will the price volatility reduce speculative behaviors in the more liquid asset markets?
What To Watch Today
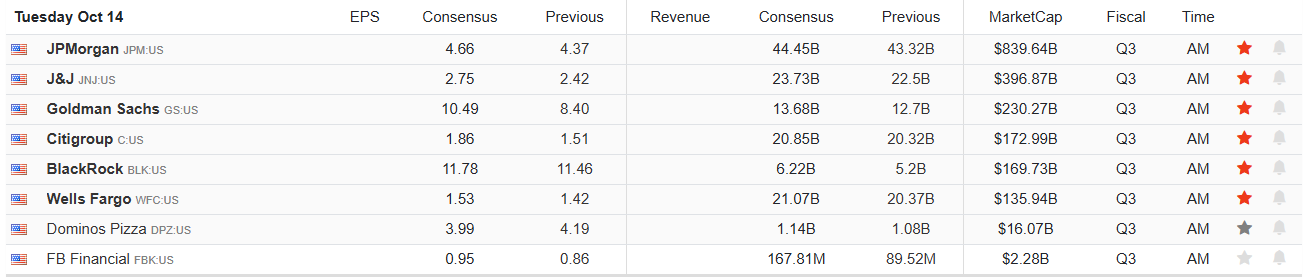
Earnings
(Click on image to enlarge)
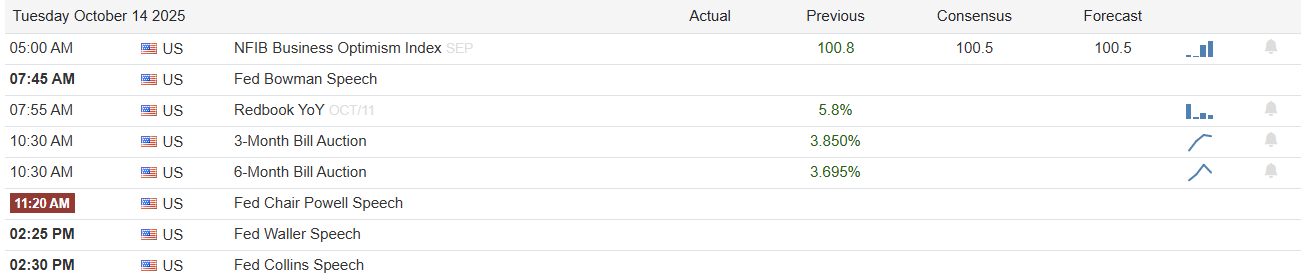
Economy
(Click on image to enlarge)
Market Trading Update
Yesterday, we reviewed the technical backdrop to the market as we entered a new trading week. The big question was whether investors would “BTFD” after Friday’s break, and that answer came with a resounding “yes” on Monday as investors piled back into risky trades and trades related to the ongoing themes of AI, rare earth, and precious metals.
However, these trades are all getting significantly extended on many technical basis, and as we saw on Friday, reversals will be sharp when they occur, leaving investors exposed to risk. As Sentiment Trader noted yesterday, a sharp reversal from an all-time high, combined with a significant volatility spike, typically suggests near-term market headwinds. To wit:
“The S&P 500 plunged to close with a loss of 2.71%-its largest single-day decline since April. The technology sector was the epicenter of the decline, with the Nasdaq Composite plummeting 3.6%. This type of sharp reversal raises a critical question: Was this merely a one-off, news-driven event, or does it represent the start of a more significant downturn?
To assess the potential implications, we can quantify this series of events into a specific, testable signal. Let’s conduct a study based on the following conditions, all of which must occur within a 21-session window:
- The S&P 500 Index sets a new all-time high.
- The S&P 500 then registers its largest single-day percentage decline over a 125-session period.
- The Volatility Index (VIX) experiences a single-day rate of change greater than 31%.
“This precise combination of a market high, a volatility spike, and a momentum breakdown is a rare occurrence, and it has now triggered.””

“When this rare combination of events has occurred in the past, the S&P 500’s performance has followed a distinct and potentially deceptive pattern. The data shows a tendency for a strong initial bounce, which then gives way to a period of significant weakness. One month after a signal, the market was higher 85% of the time with a median return of +2.9%. This suggests an initial “buy the dip” reaction has been common.
However, that strength has historically proven to be a bull trap. By the two-month mark, the win rate plummeted to 62%, barely better than a coin flip, and the three-month win rate was only 69%. This two-to-three-month window appears to be the point of maximum vulnerability for the market after this signal. The most dramatic recent example was the signal on February 24, 2020, right at the onset of the COVID-19 crash, where the S&P 500 plunged -24.1% in the following month.”

As they conclude:
“An objective review of similar historical setups reveals a distinct data pattern. The precedents show a tendency for an initial rebound in the first month, which was then followed by a period of market weakness and inconsistency. The historical data also shows that a significant portion of these signals were followed by drawdowns exceeding 10% and a rotation into defensive sectors”
This analysis follows much of own which suggests that we will likely see a defensive rotation at some point as “risk” is reversed from the market. Timing is always the key, but being aware of the potential for such a rotation provides opportunity to rebalance portfolios accordingly.
Maybe the break on Friday was just a “one off” event that will be immediately bought sending markets back to all-time highs. If so, that is an easy process to navigate. But the real question we need to ask is “what if it isn’t?”
Trade accordingly.
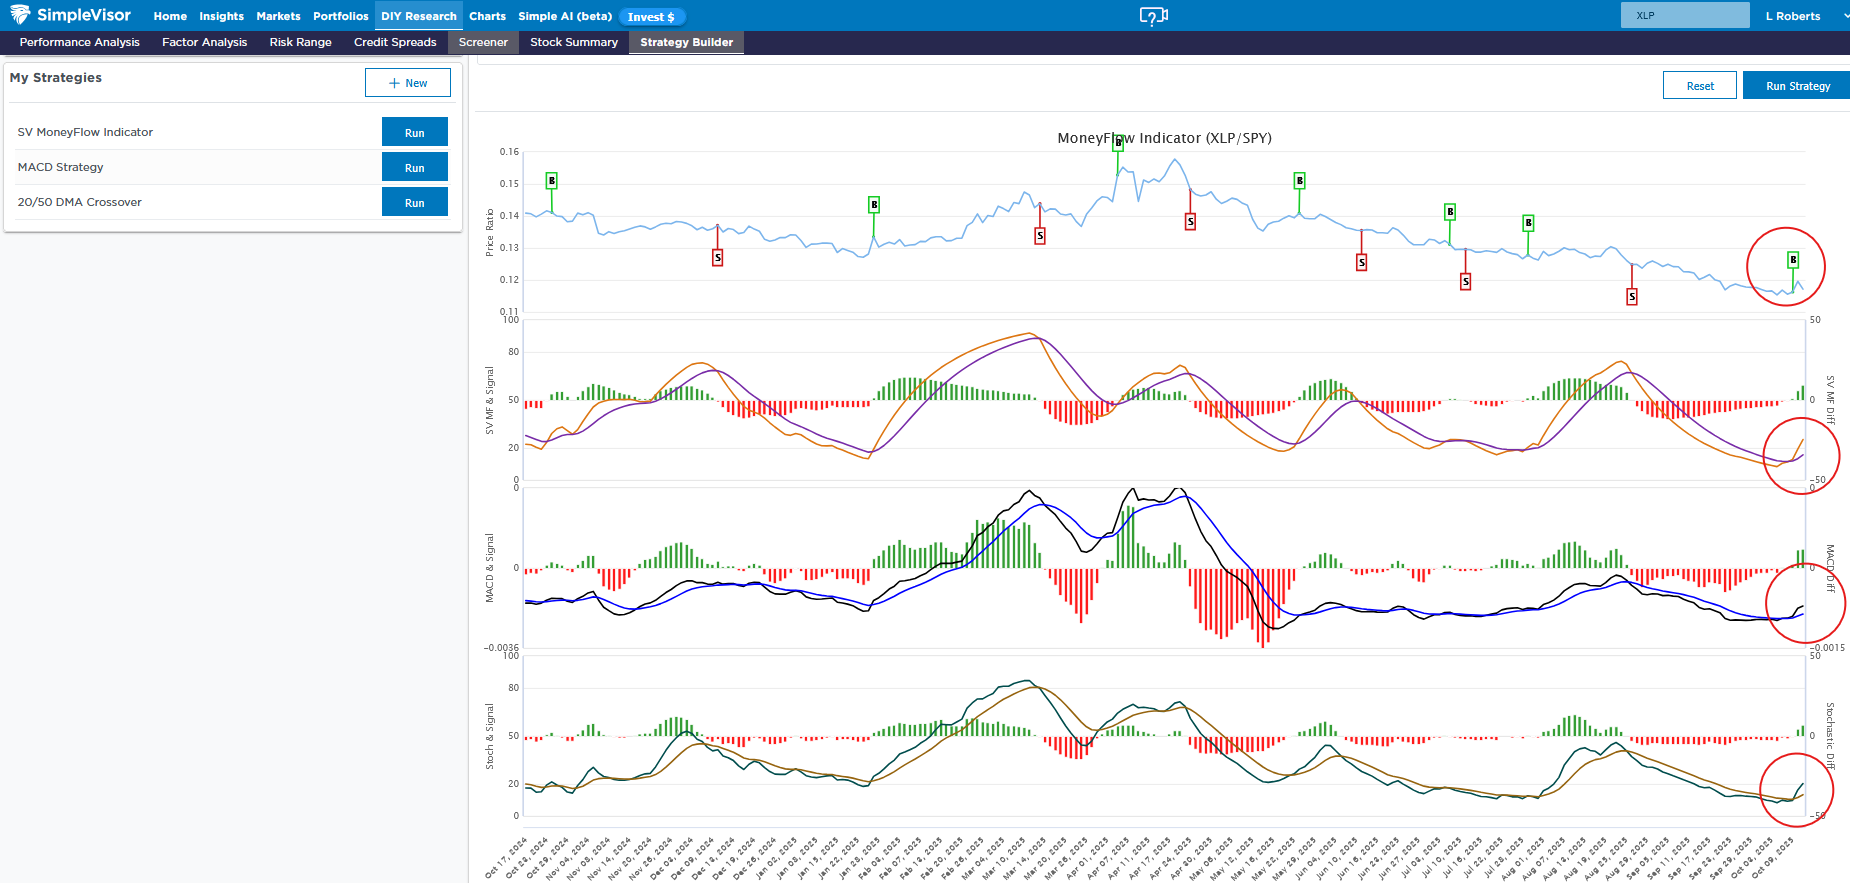
Are Staples Sending A Sell Signal?
The graph below, courtesy of SimpleVisor, does technical analysis on the ratio of the Staples (XLP) to the S&P 500 (SPY). The blue line in the top graph is the price ratio of the two. As shown, staples have consistently underperformed the market since the April lows. Given that staples and other more conservative sectors tend to underperform in upward trends and relatively outperform in downward trends, it is worth appreciating whether the relationship between XLP and SPY is changing. The bottom three graphs indicate that various stochastic studies on the price ratio are all generating buy signals from their lowest levels in at least a year. This raises the question of whether the buy signal is durable or just a short-term bounce, largely due to the big sell-off last Friday.
ChatGPT Gives Financial Advice On Volatile Markets
When market volatility strikes, this is the moment that you should do… nothing. As we discussed last year with the “Yen Carry Trade Blowup:”
“As an investor, the most crucial action to take during an ‘unexpected, exogenous event ‘ is to DO NOTHING. That’s right, don’t do anything. When something occurs, like a sharp market correction, our initial emotional response is to take action and begin liquidating positions. Such would certainly seem to be a logical reaction; however, more often than not, the time to sell positions was ahead of the event. Over the last two months, we have repeatedly warned that a 5-10% market correction was likely heading into the election.”
Such is also what ChatGPT suggested.
“When markets get choppy, our instinct is often to react. But most of the time, doing less is actually better. Here are some strategies to keep calm and carry on:“
- Distract Yourself: Instead of doomscrolling through financial headlines, reorganize your kitchen pantry, alphabetize your bookshelf, or take your dog for a walk. Anything that keeps your hands off your phone works wonders.
- Remember the Market Has Mood Swings: Think of the market as a moody teenager. One minute it’s soaring, the next it’s sulking over a tweet or a Fed comment. Trying to reason with it is futile.
- Indulge in Comfort Food: Yes, your kale smoothie can wait. When the market plunges, treat yourself to pizza, ice cream, or whatever makes you feel better. Stress eating might not move the market, but it’ll make you feel more human.
- Avoid the Drama: Headlines are written for clicks, not your benefit. “BREAKING: Markets Plunge” might sound dire, but in the grand scheme, it’s just noise. Avoid it and focus on the bigger picture.
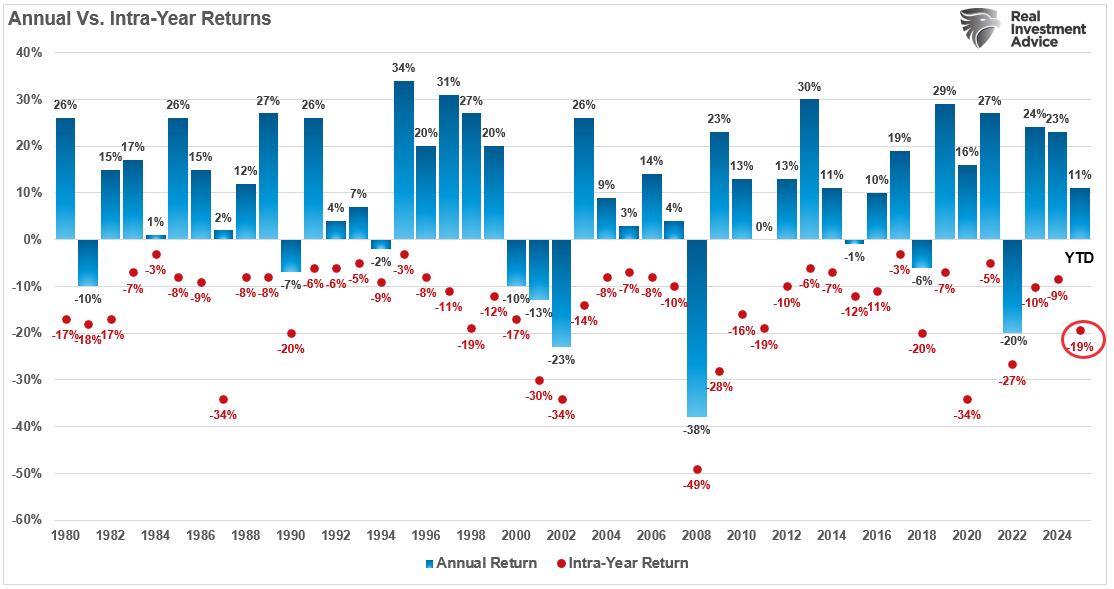
Crucially, investors must remember that markets have intra-year corrections EVERY YEAR. Yes, 5-10% corrections during any given year are entirely normal. While the 19.2% correction in 2025 was larger than the average, there was a 9% correction in 2024, 10% in 2023, and 27% in 2022. Yet, after all the headlines of recession, rate hikes, bear markets, and tariffs, the markets are substantially higher than they were four years ago.
Tweet of the Day
More By This Author:
ChatGPT Gives Financial Advice On Volatile MarketsFirst Brands: Canary In The Rehypothecation Coal Mine?
Market Crack Or Beginning Of Something Bigger


Comments
Log in or sign up to join the conversation.