
Inflation 18% And Sticky
What will the Fed meet bring for the major markets?
(Click on image to enlarge)
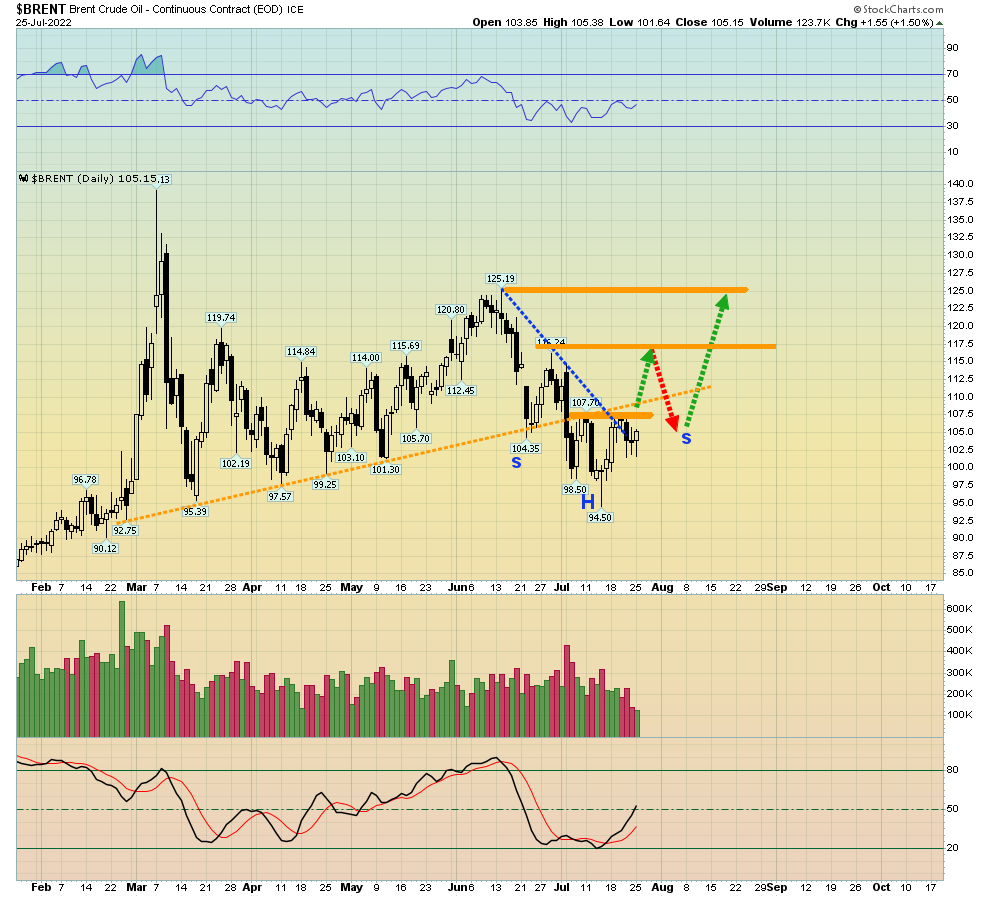
Brent crude oil chart
There’s an inverse H&S bottom in play and Brent may be leading the price of Texas crude because of the Ukraine war.
If major commodities like oil (and gold!) are bottoming, the Fed may be more aggressive than stock market investors would like… even with growth fading and America already in a de facto recession.
Also, the Fed’s QT program is set to accelerate in September. This is going to put more pressure on the government to reign in its vast array of ludicrous global meddling and regime change schemes.
The US government is unlikely to reduce spending at all. Sadly, US homeowners carrying million-dollar mortgages don’t have the luxury of making laws for themselves. Nor can they order the Fed to buy their debt with printed money. The bottom line:
Stagflation may be here to stay… for the next 30 years.
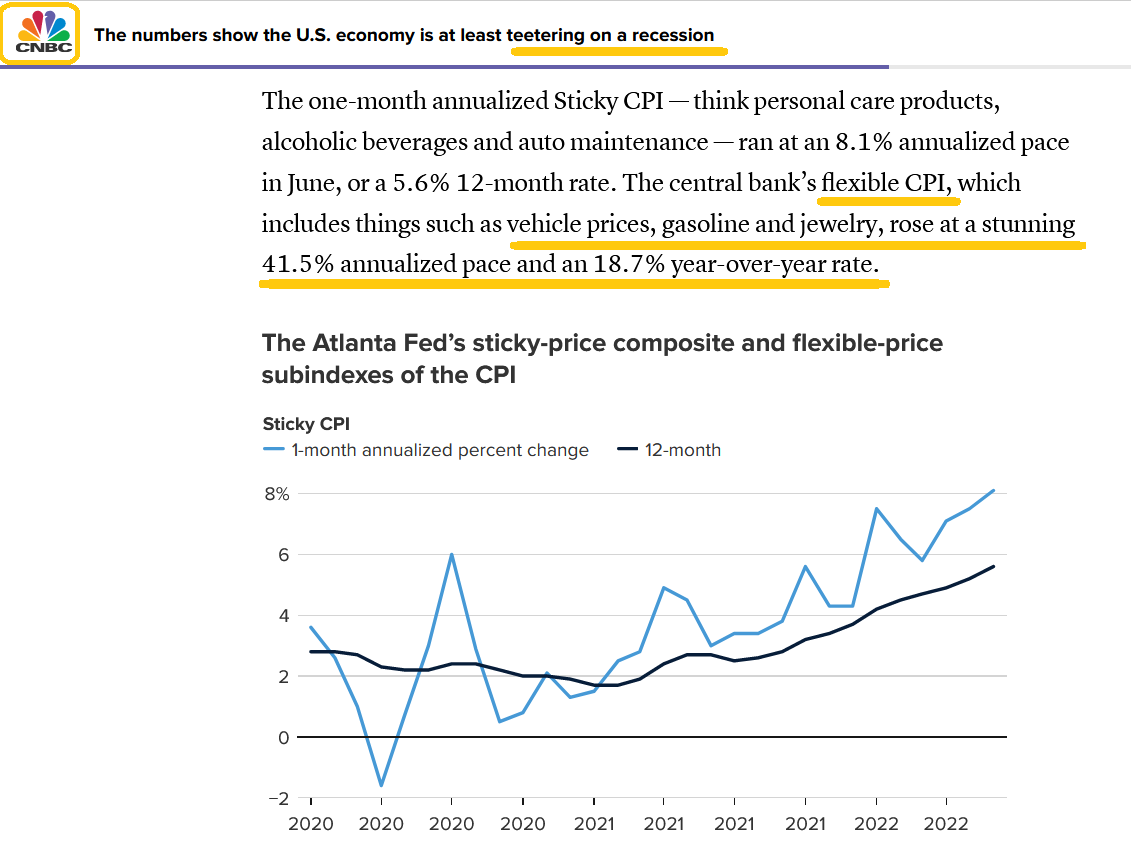
A number of gold bugs have tried to create “real inflation” indexes, but the Fed’s Sticky CPI already does that.
Real US inflation is likely in the 18% range that is indicated by the Sticky index, and topped 40% in June!
The current inflation is related to Corona and the Ukraine war. Fed man Jay may be gazing beyond the current price drivers and into a future where energy transition (dirty to clean) and empire transition (West to East) dominate the economic landscape. Both are highly inflationary.
While there will be lulls in inflation (there just was one with commodity prices), Jay may see decades of inflation ahead. Horrifically, the problem is compounded by the US government’s refusal to cut spending at all, let alone in a serious way.
Tactics?
(Click on image to enlarge)

Smart money is moving into gold (and I would hope that includes most small investors in the Western gold community).
(Click on image to enlarge)
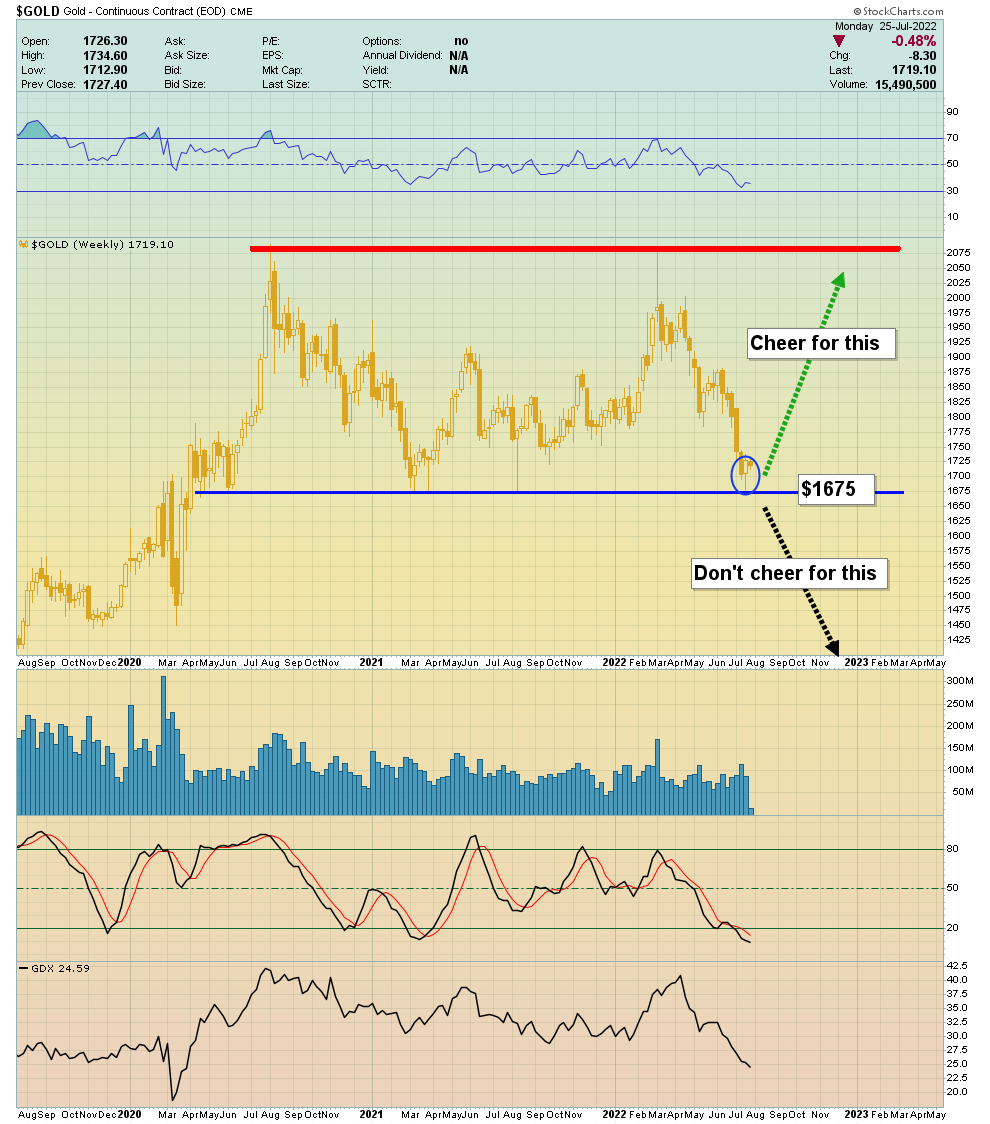
weekly gold chart
The price and oscillator action at $1675 is impressive.
For a look at the daily chart,
(Click on image to enlarge)
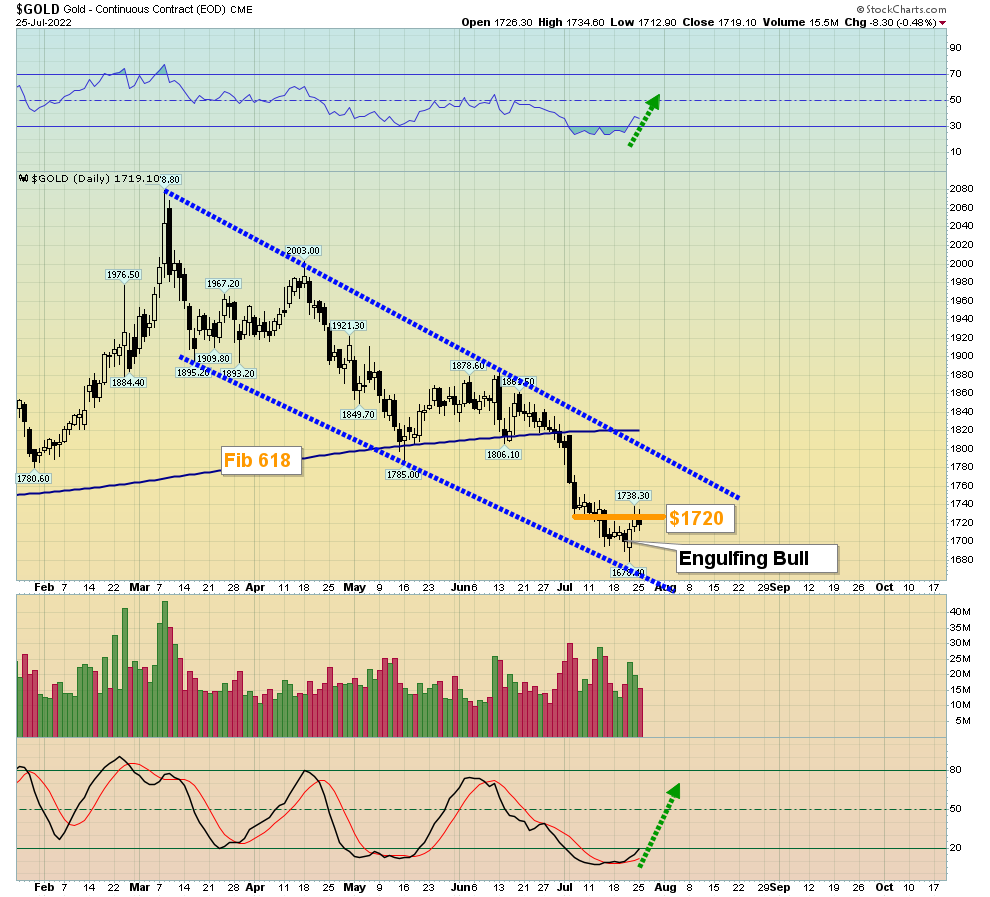
A big engulfing bull candlestick appeared at the $1675 support zone. It suggests that whatever the Fed does tomorrow, gold is in good shape.
What about the miners?
(Click on image to enlarge)
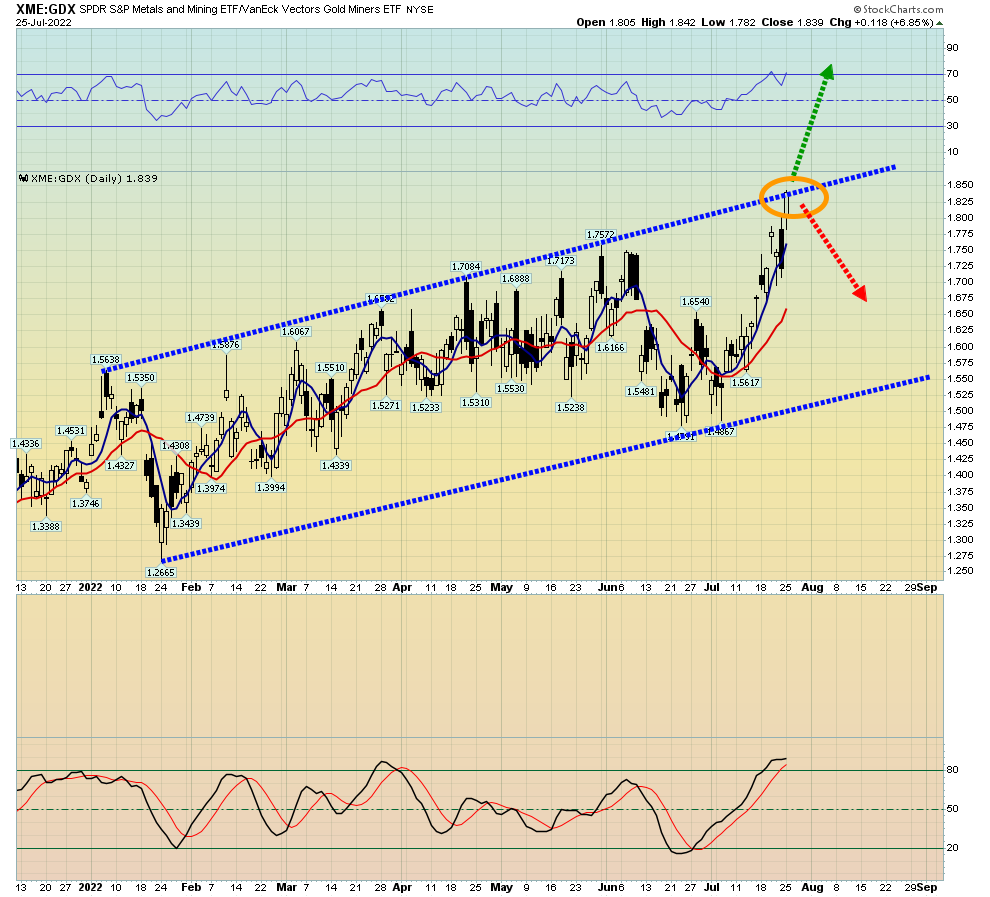
XME gives gold bugs exposure to both base and precious metals stocks. At one point, the two biggest holdings in the XME ETF were the silver companies Coeur d’Alene and Hecla. That can happen again.
It’s an ideal holding that can help investors manage both the growth of post-Corona China and the danger of economic collapse in America.
(Click on image to enlarge)
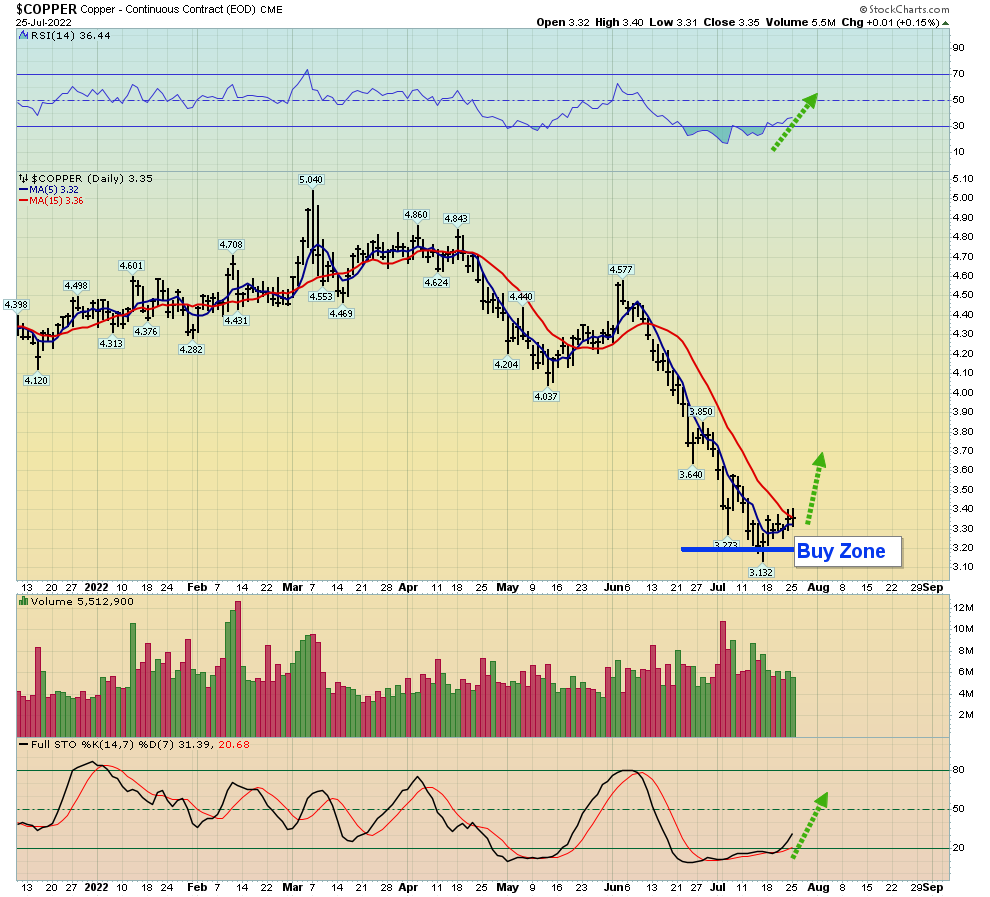
copper price chart
Months ago, I laid out $3.20 as a key buy zone. A rally looks imminent.
Nancy Pelosi seems eager to ramp up tension between China and America and she’s likely to succeed if she makes her upcoming trip to Taiwan. That could create severe supply chain issues for metals like copper.
Economists refer to Copper as “Doctor Copper”, because it tends to indicate economic strength when the price rallies, and economic weakness when it declines.
That changed in early 2022 when stagflation appeared.
Doctor Copper may soon become better known as Doctor Stagflation.
What about the silver miners?
(Click on image to enlarge)
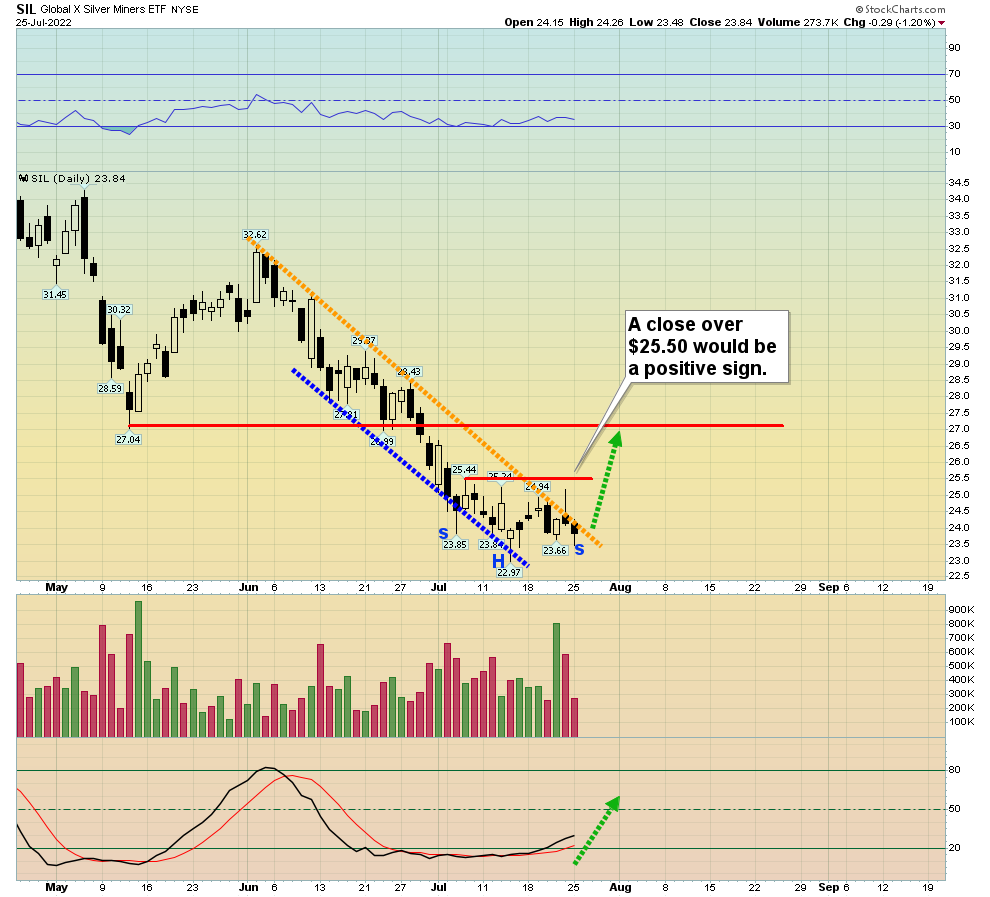
SIL chart
There’s a rough inverse H&S bottom in play. These patterns indicate a low is either here or very near.
Given that the Fed’s “Sticky” inflation index shows inflation is 18% and commodity prices may be set to rally, once the Fed meeting is over, SIL is likely to offer investors an ideal entry point on Thursday morning!
More By This Author:
Gold & A Failed Oil Price Cap
Gold & The Dollar Rally Time For Both
Bullion & Miners: Winning Plays Now


