
Making sense of home sales and prices data is challenging as there is little activity in the real estate markets. High mortgage rates have made it difficult for buyers to buy homes. Accordingly, more would-be sellers are unable or unwilling to sell because they do not want to trade their current low mortgage rate for a much higher one with a new home.
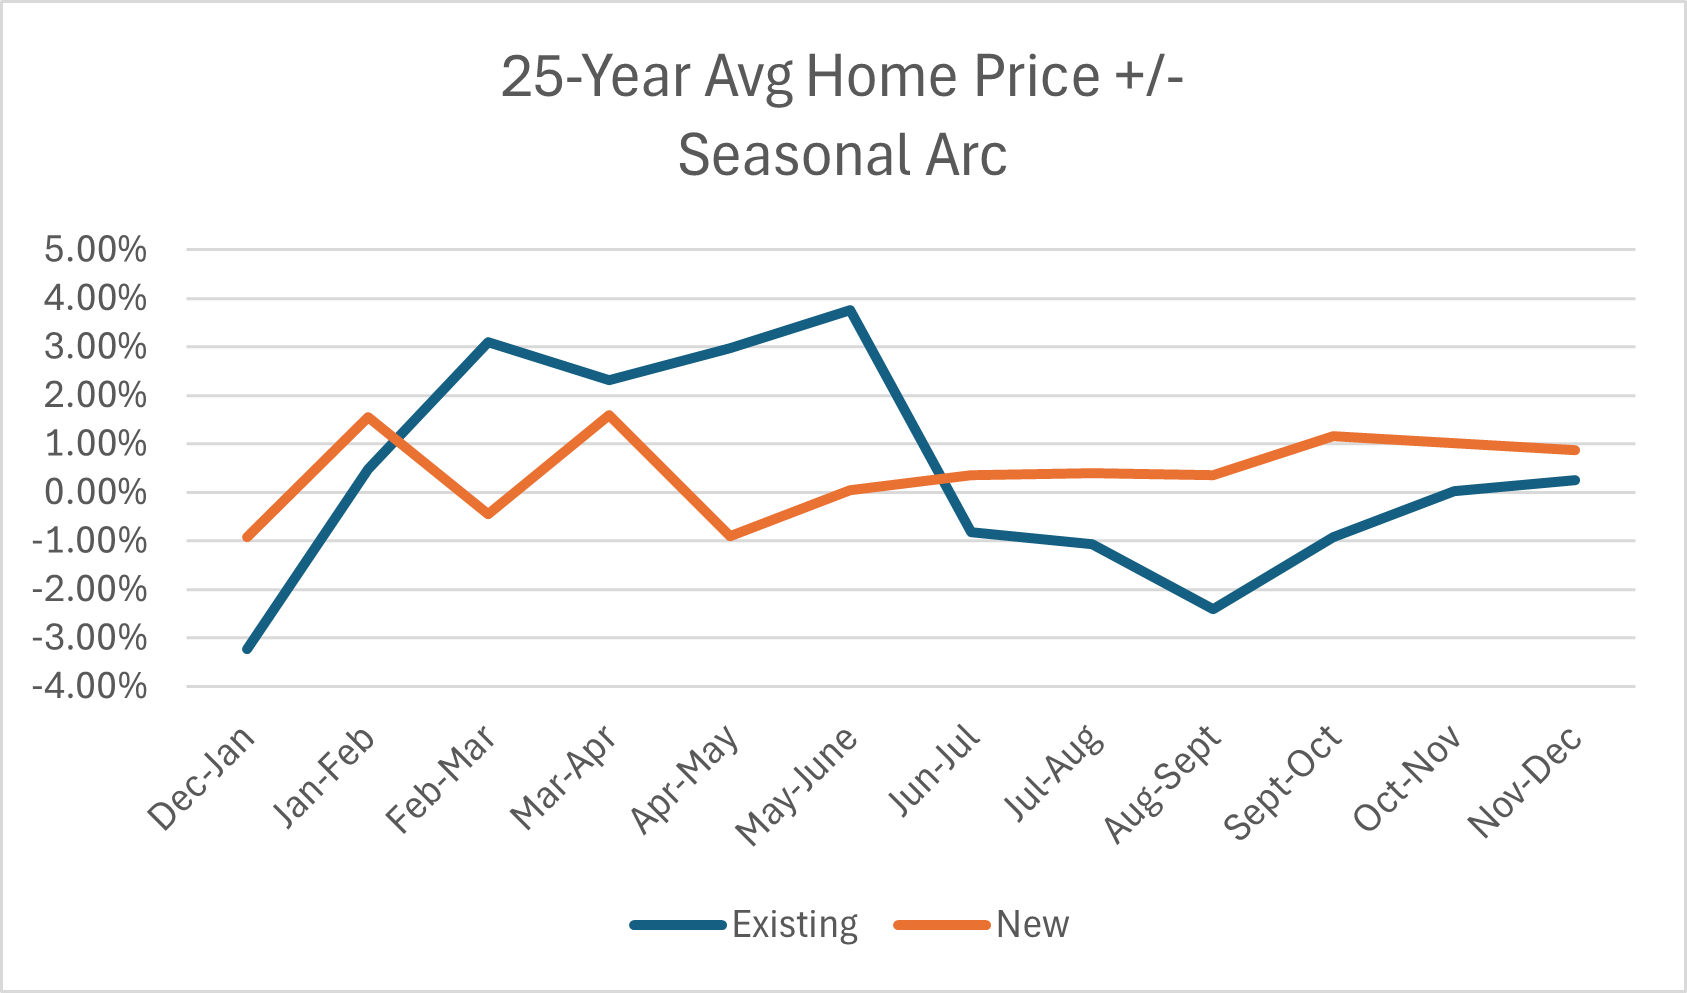
The latest data from the National Association of Realtors (NAR) shows existing home sales fell in June to a seasonally adjusted annual rate of 3.89 million homes. On a non-seasonally adjusted rate, it was 375k, the lowest level in June going back to 1999. The prior low was in June of 2008. The median home price rose 4.1% to $426,900. There is some hope for homebuyers that home price growth may slow. The inventory of unsold existing homes rose to 4.1 months of supply. Furthermore, June marks the end of the buying season. As shown below, existing home prices (blue) often decline as the buying season ends. The Chief Economist from the NAR sees the potential for a buyer’s market to emerge as home prices potentially moderate. Per the latest NAR report.
“We’re seeing a slow shift from a seller’s market to a buyer’s market,” said NAR Chief Economist Lawrence Yun. “Homes are sitting on the market a bit longer, and sellers are receiving fewer offers. More buyers are insisting on home inspections and appraisals, and inventory is definitively rising on a national basis.”
What To Watch Today
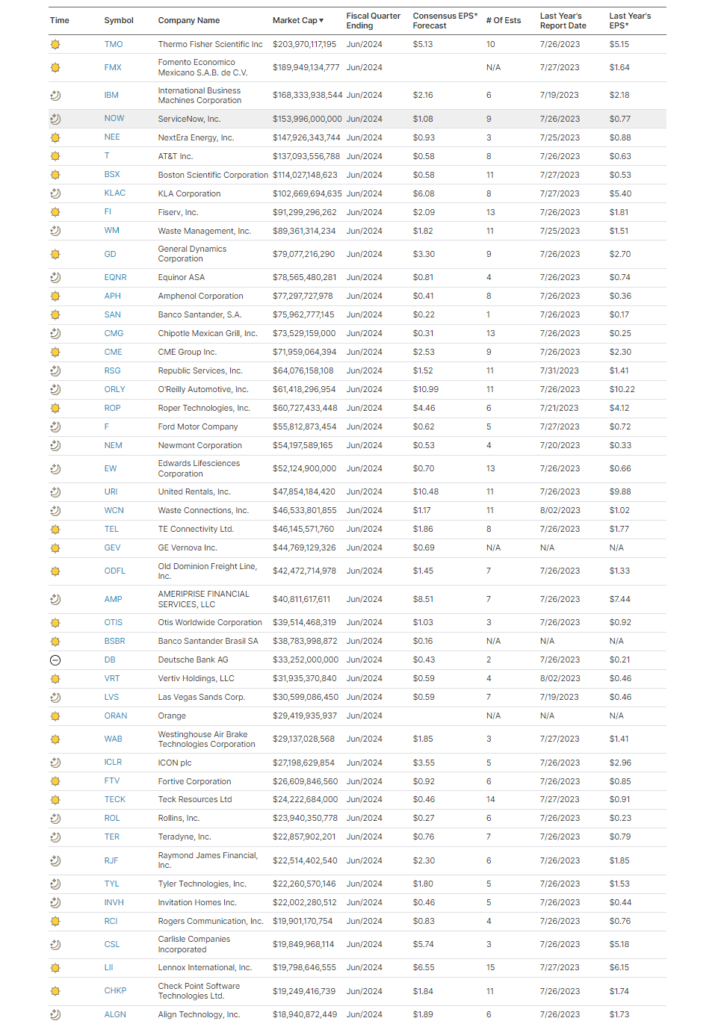
Earnings
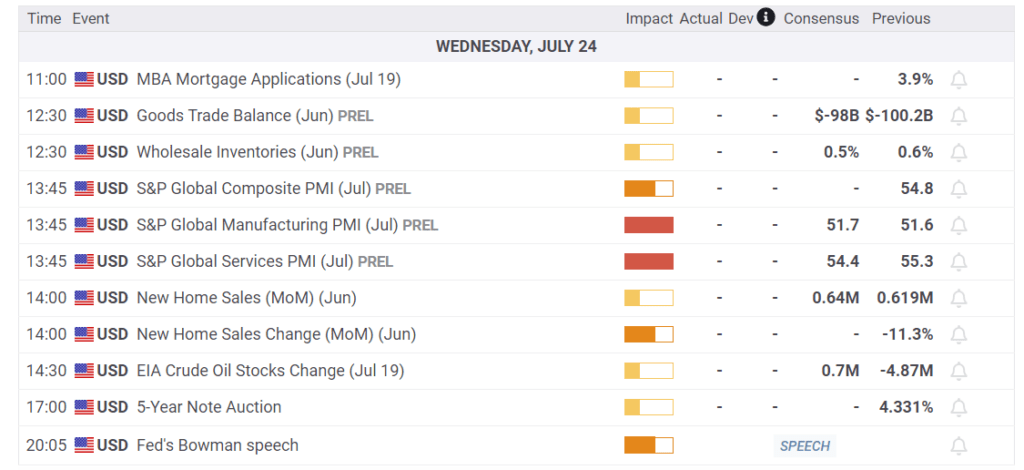
Economy
Market Trading Update
As noted yesterday, market breadth has improved recently, which provides support for a continued bullish rally. The recovery of the 20-DMA and the drop in the VIX also support a continued bull market for now. However, this does not negate the potential for a 5-10% correction later this summer heading into the election. As shown, during presidential election years, the markets tend to de-risk a bit before the election simply due to the risk of the outcome.
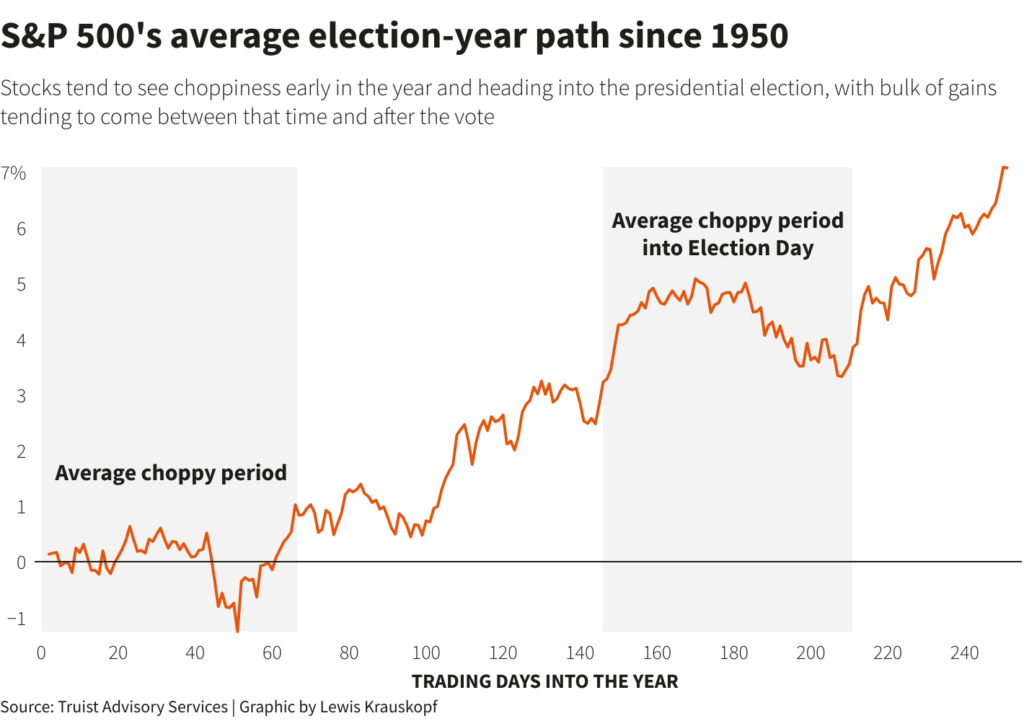
Could this year be different? This is why it is important to maintain exposure for now and continue to manage risk as needed.
There are plenty of reasons to be very concerned about the market over the next few months. We suggest using rallies to reduce equity exposure and hedge risks accordingly.
- Move slowly. There is no rush to make dramatic changes. Doing anything in a moment of “panic” tends to be the wrong thing.
- If you are overweight equities, DO NOT try to fully adjust your portfolio to your target allocation in one move. Individuals often feel like they “must” do something. Think logically about where you want to be and use a rally to adjust to that level.
- Begin by selling laggards and losers. These positions were dragging on performance as the market rose, they tend to lead on the way down.
- Add to sectors or positions performing with or outperforming the broader market if you need risk exposure.
- Move “stop-loss” levels up to recent lows for each position. Managing a portfolio without “stop-loss” levels is like driving with your eyes closed.
- Be prepared to sell into the rally and reduce overall portfolio risk. You will sell many positions at a loss simply because you overpaid for them to begin with. Selling at a loss DOES NOT make you a loser. It just means you made a mistake.
- If none of this makes sense to you, please consider hiring someone to manage your portfolio. It will be worth the additional expense over the long term.
Follow your process.
Small Caps Have Potential, But…
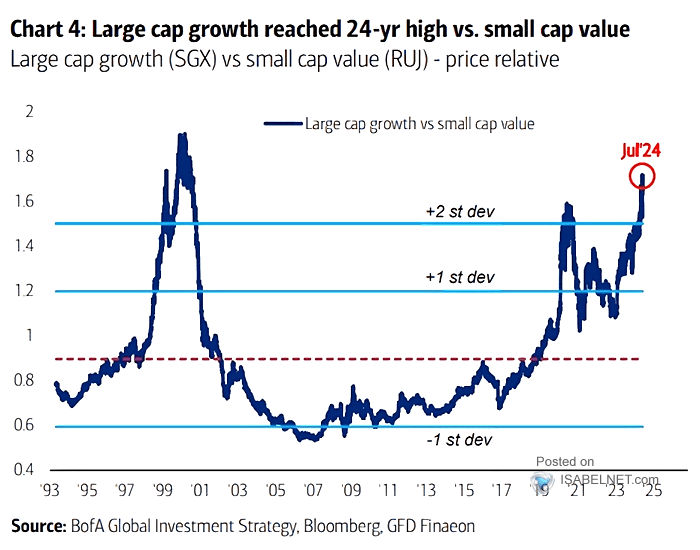
Many investors are starting to think small-cap and value stocks may finally be in vogue. The rotation from large-cap growth to those sectors was certainly eye-opening these past few weeks. Before jumping into the small-cap value camp, consider the important differences between the two indexes.
The BofA graph below, courtesy of ISABELNET.com, shows the price ratio of large-cap growth versus small-cap value stocks. Excluding the sharp drawdown in the ratio in 2020, large-cap growth stocks have consistently outperformed small-cap value stocks since the end of the financial crisis. Generally, large-cap and growth stocks outperform during periods of economic growth. Conversely, small-cap and value stocks outperform during recessions. Not surprisingly, valuations tend to expand during economic growth and contract during recessions. Therefore, much attribution for the recent gross outperformance of large-cap growth versus small-cap value can be attributed to the type of stocks the two indexes hold.
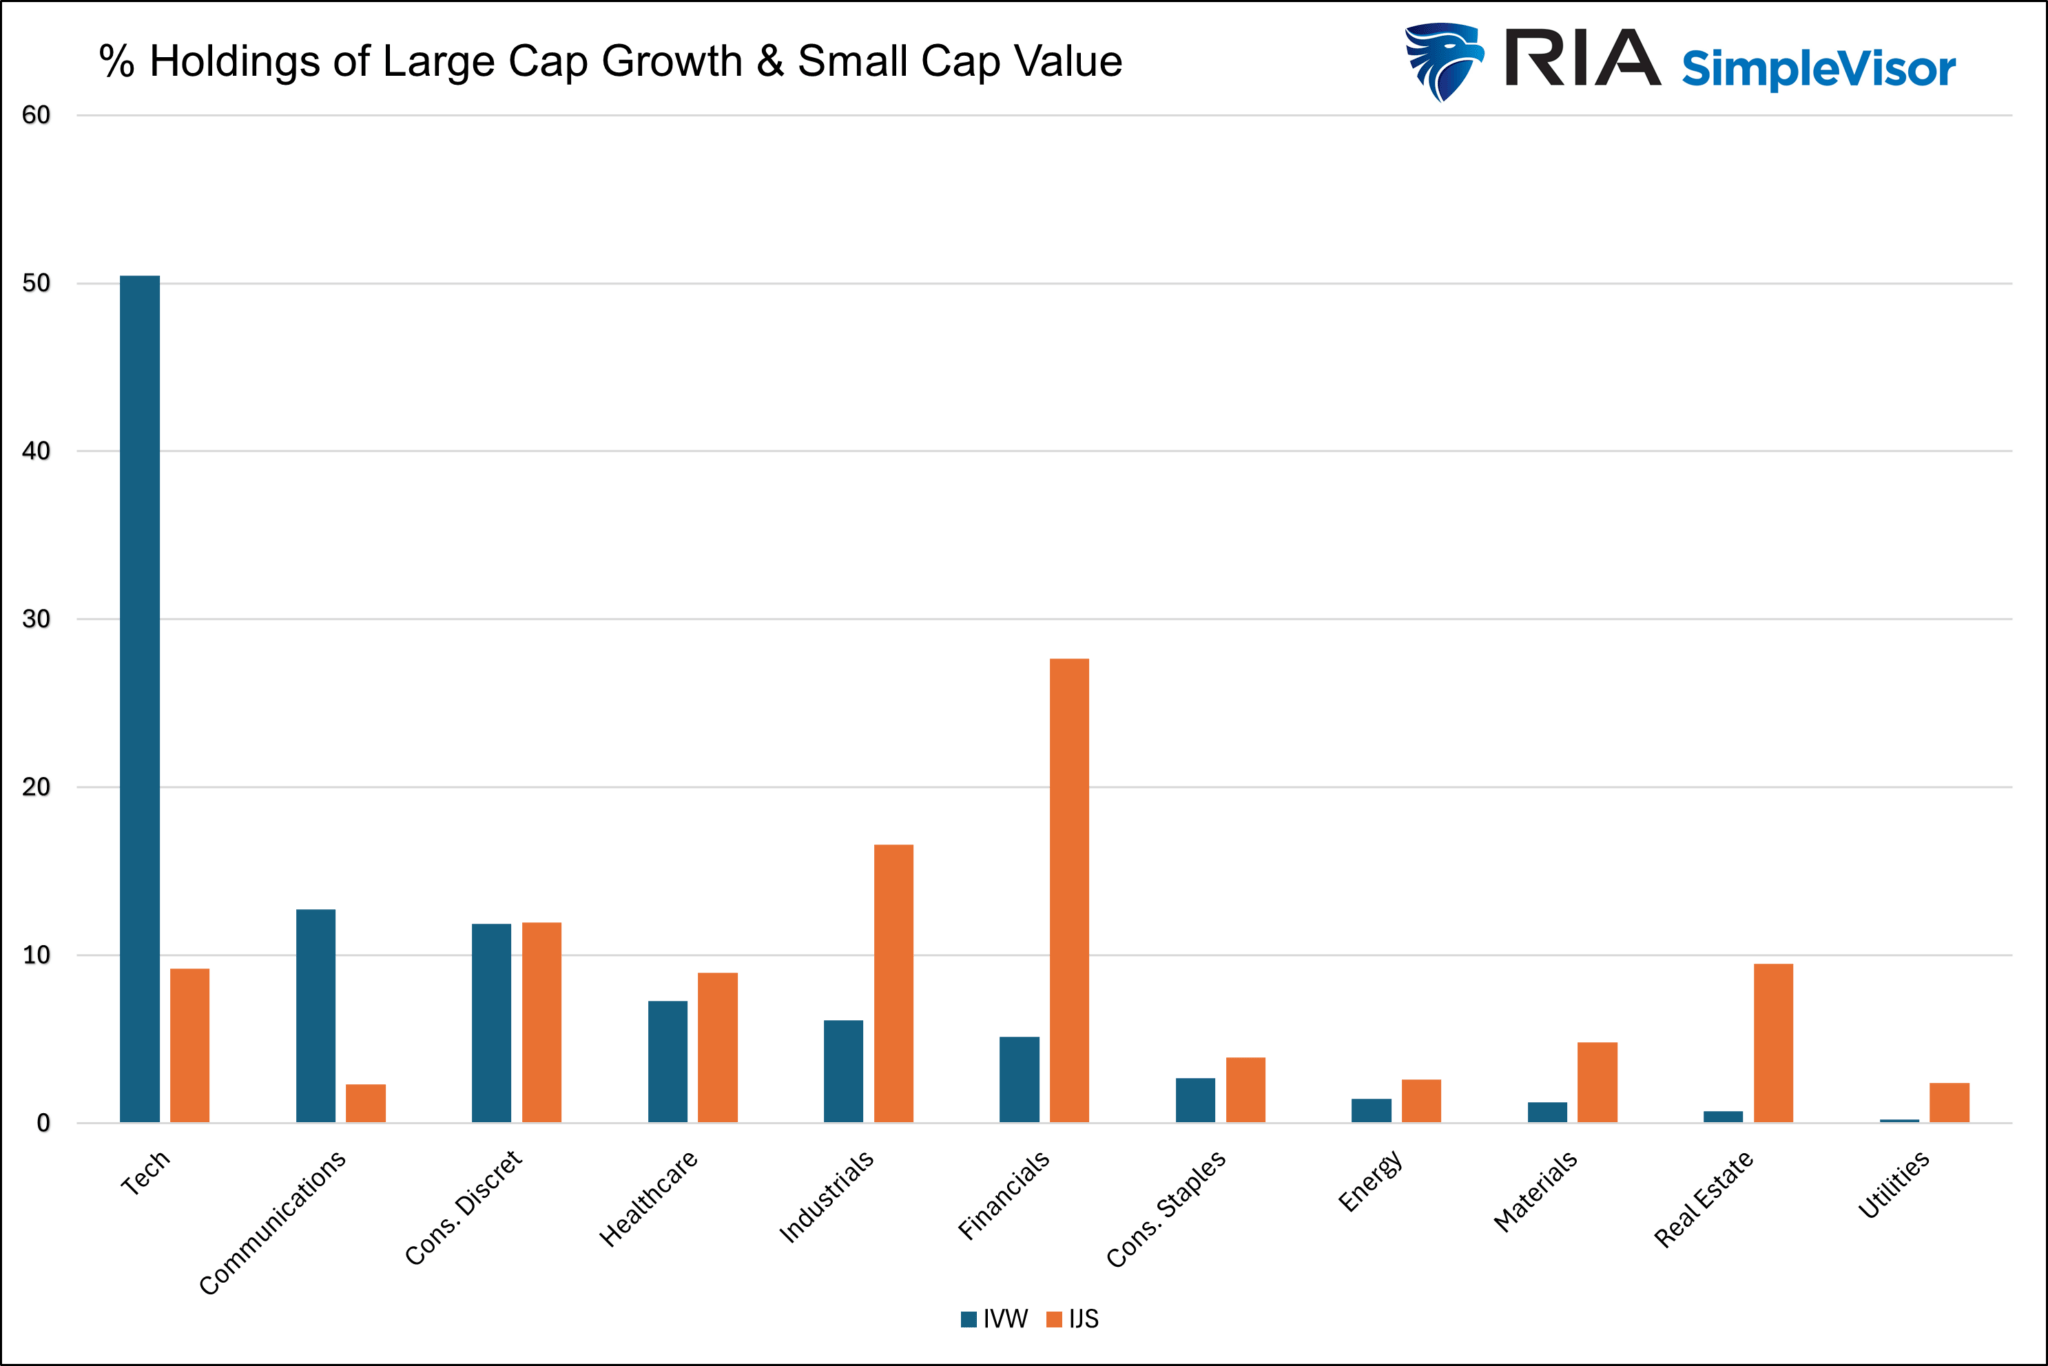
The second graph compares the holdings by sector of popular ETFs tracking large-cap growth (IVW) and small-cap value (IJS). As shown, technology accounts for a big difference between the two ETFs. It represents 50% of IVW and slightly less than 10% of IJS. Conversely, financials are only 5% of IVW but 28% of IJS. The point of showing these stark differences is that the price ratio graph may not revert to normal, as some investors appear to believe. Simply put, the massive differences in the type of stocks, growth patterns, and valuations of said stocks should lead to long-term performance differences. Those differences may get extreme sometimes, but correcting to the average is far from a foregone conclusion.
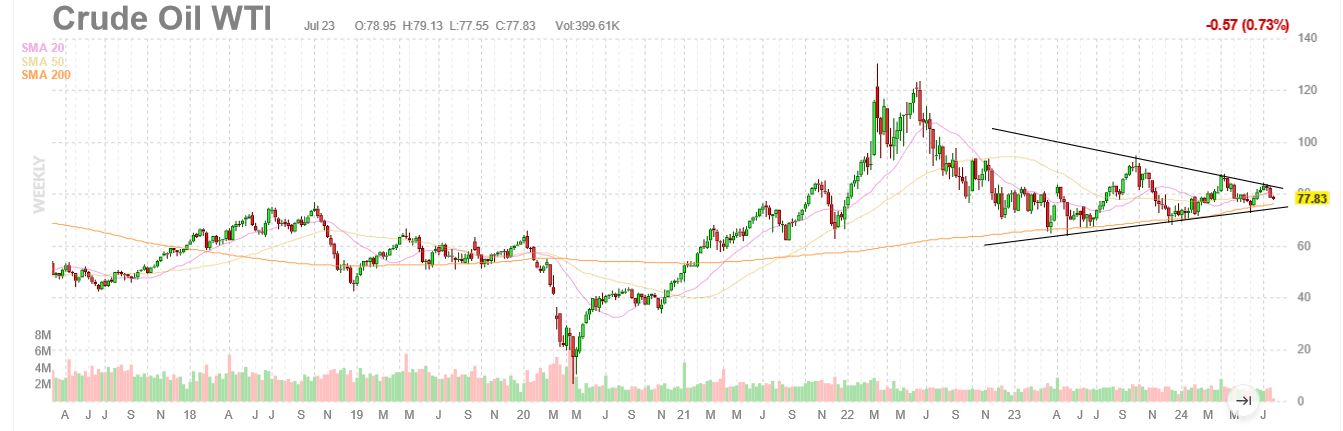
A Crude Oil Breakout Is Likely
For the past year, the price of crude oil has been forming a wedge pattern. The pattern, as shown below, is a series of lower highs and higher lows that is increasingly becoming less range-bound. Often, such a pattern ultimately resolves itself with a sharp move. The question is, what direction? Further signs of a slowing economy may mean that the resolution of the pattern will result in lower oil prices. Political or geopolitical concerns could also dictate the breakout.
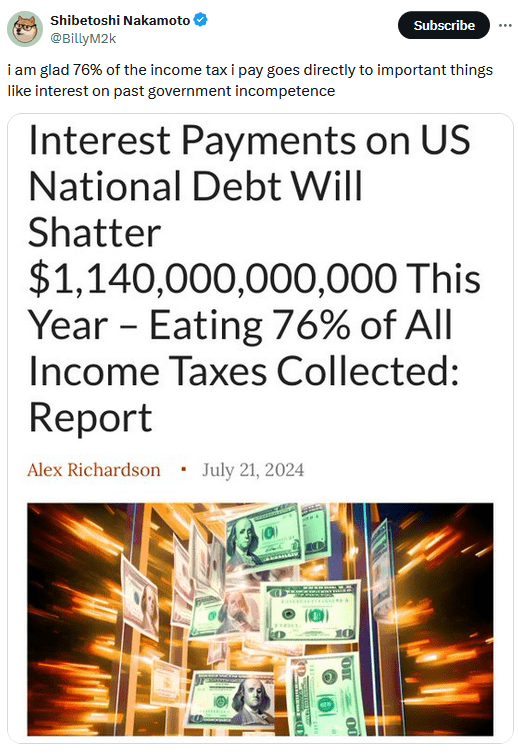
Tweet of the Day
More By This Author:
Market Breadth Improves Amid Massive RotationThe Bull Market – Could It Just Be Getting Started?
Small Stocks Dominate Large Ones - What Comes Next?


Comments
Log in or sign up to join the conversation.