
Gold Prices For Action $1880 And $1808
Gold is often soft on Tuesday and… today is Tuesday.
(Click on image to enlarge)
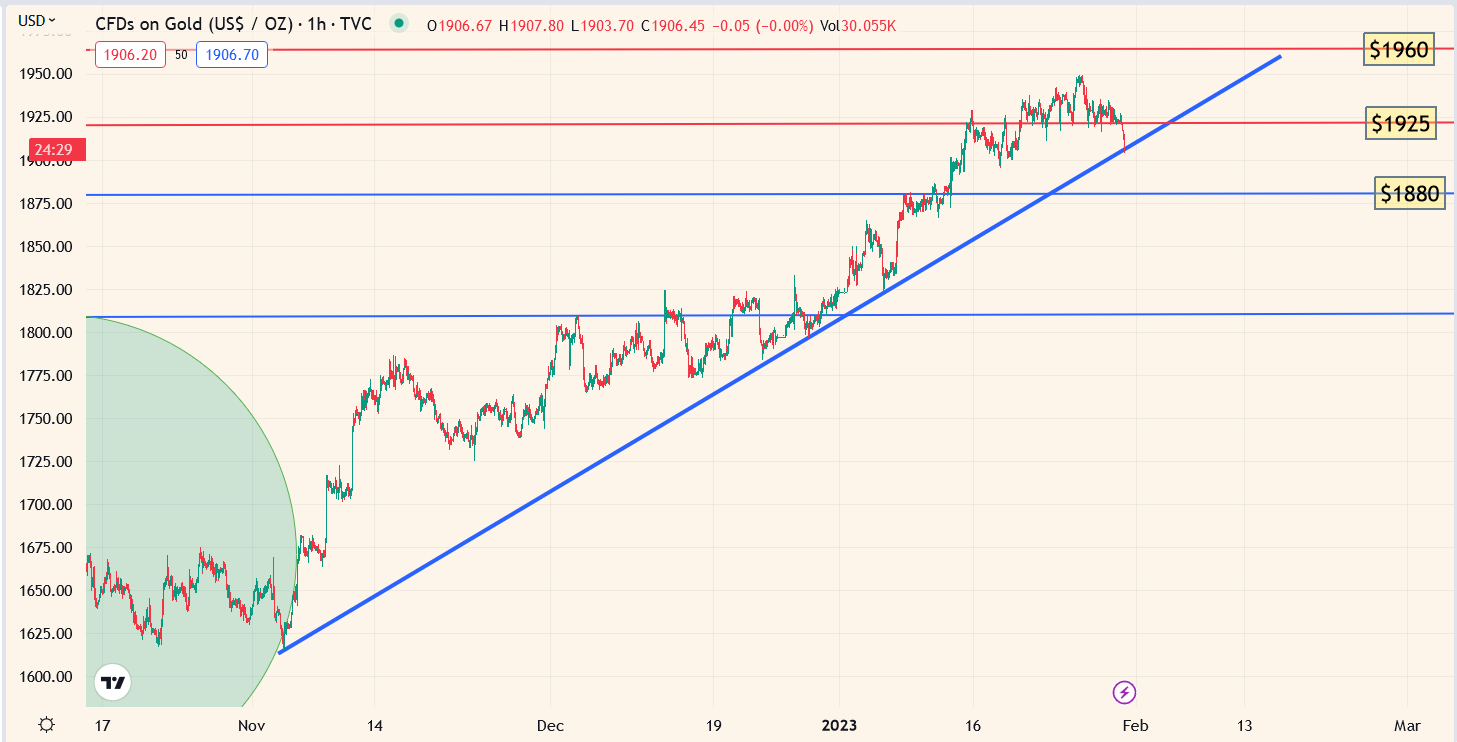
short-term gold chart
The uptrend line is being tested today, which is not a surprise.
In just a few months, gold surged from about $1610 to $1950! I’ve urged investors to sell into this massive rally.
A look at the daily chart,
(Click on image to enlarge)
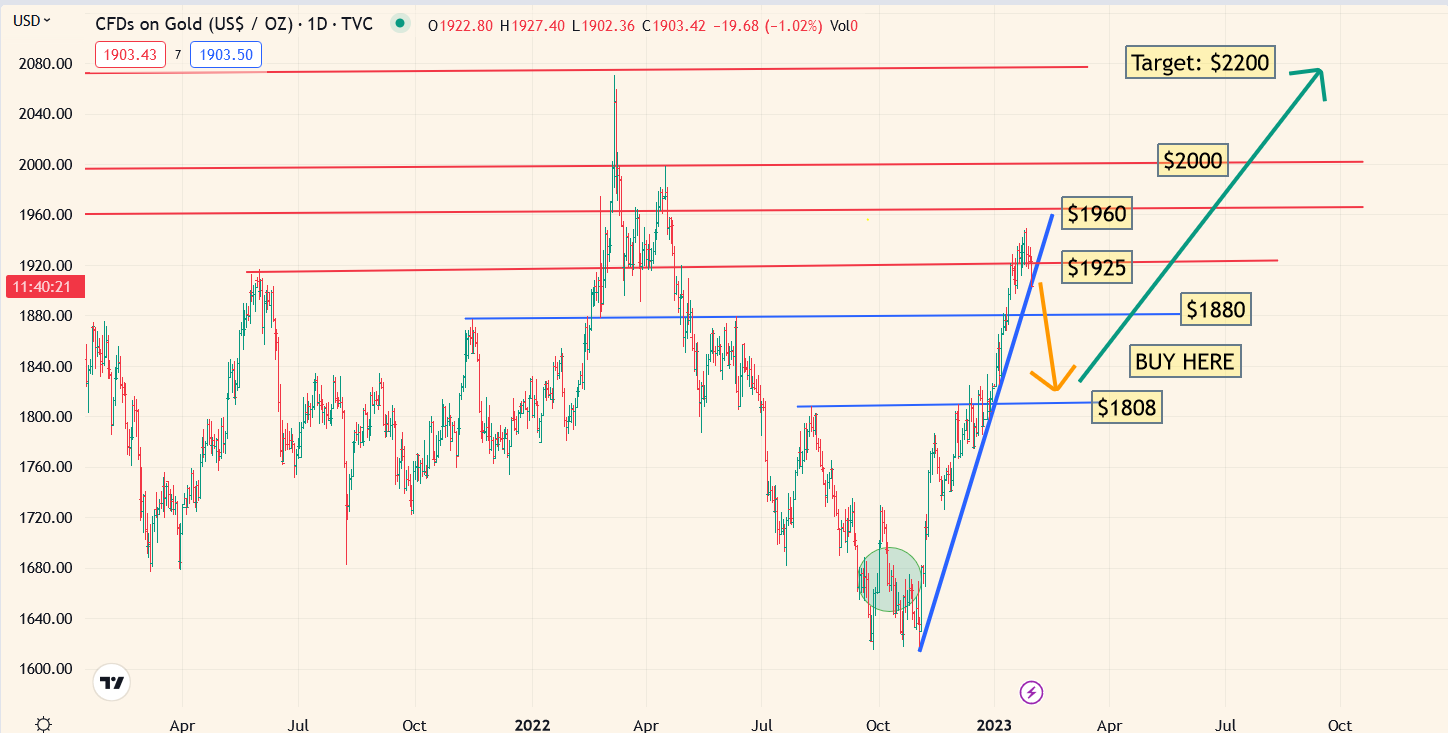
The $1880 is a key buy zone for gamblers/traders, and $1808 is for investors.
Demand in India has dropped to negligible tonnage, but citizens there are enjoying the additional wealth that the rally has created for them.
When Indian demand dries up, it’s almost always a good time for Western mining stock investors to book some juicy profits.
What about the COT report?
(Click on image to enlarge)
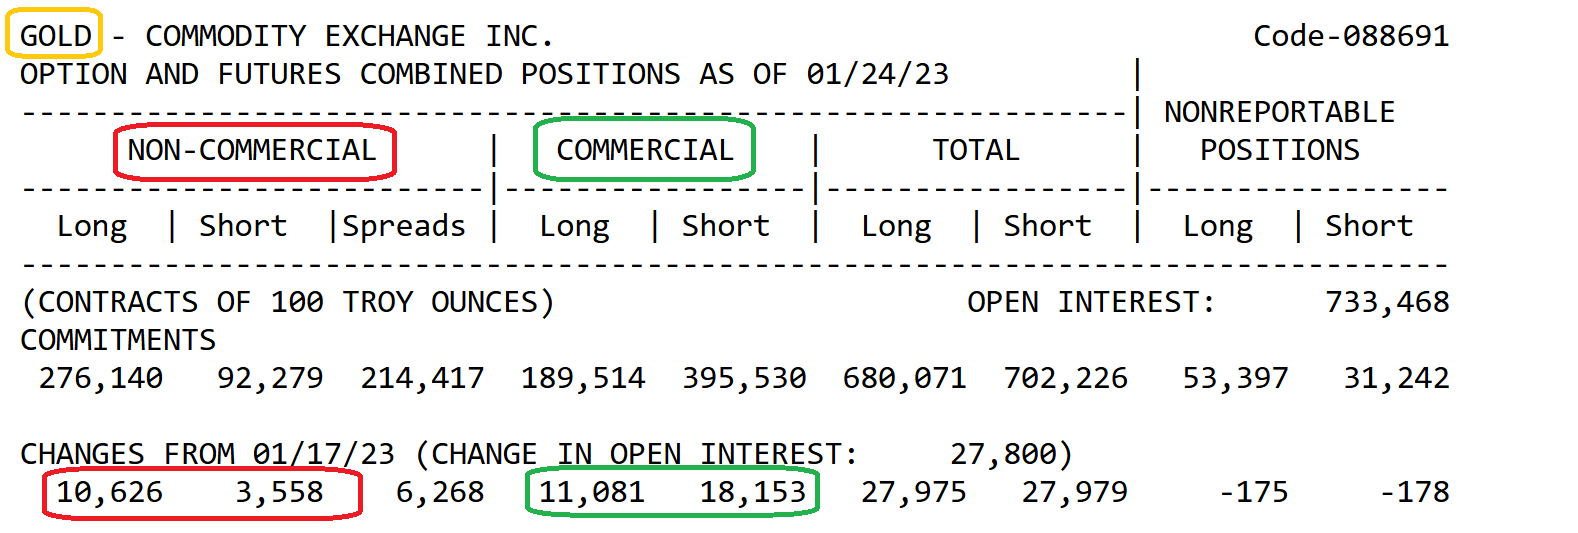
Modest commercial short positions are being added, but some longs too. There’s nothing in the COT report that should trigger significant investor concern.
The Fed rates decision is tomorrow, and gold often declines around any Fed meeting, regardless of whether it’s perceived to be positive or negative for gold.
A Fed-oriented dip from $1950 to $1880 is normal and expected after a $340/oz rally.
What about $1808?
(Click on image to enlarge)
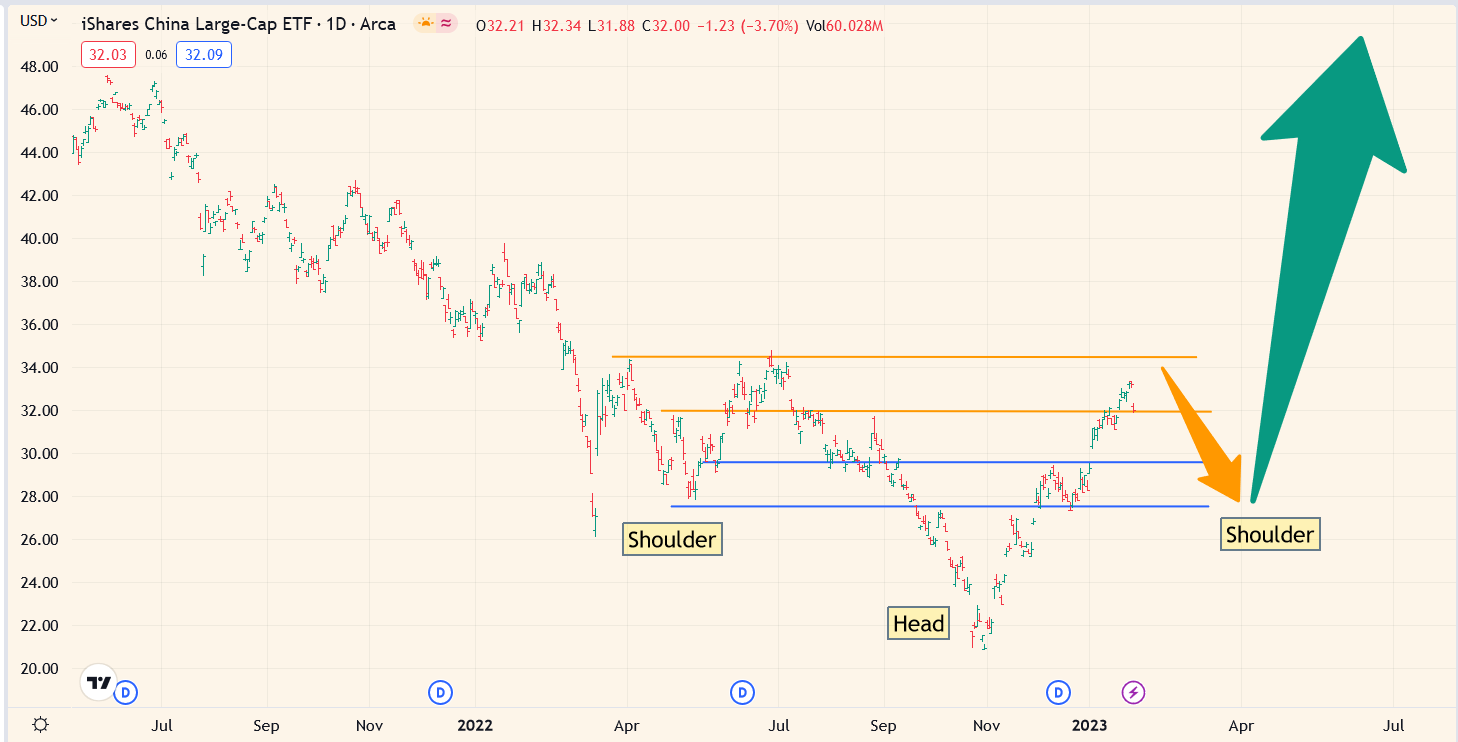
Gold has been in near-perfect sync with the Chinese stock market from the lows. A reaction is underway now for the FXI.
Most of the good news about the Chinese government Corona crisis pivot is already priced into the FXI. Chinese citizens buy gold to celebrate good economic news, but if their stock market is in correction mode, the mood sours.
The good news is the reaction could become the right shoulder of a large inverse H&S pattern… and that would be great news for gold!
(Click on image to enlarge)
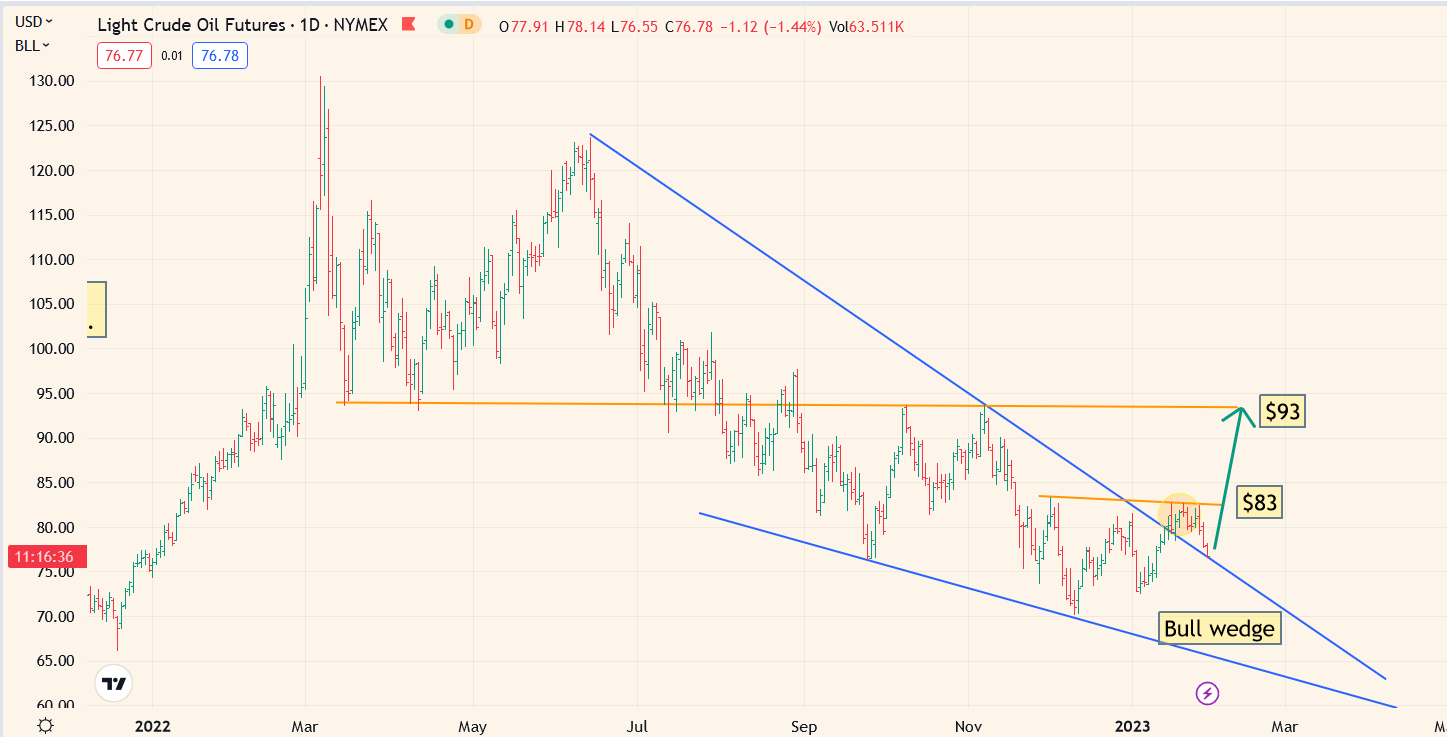
daily oil price chart
As expected, the price action after the bull wedge “breakout” has been anemic. The bottom line:
Gold can rally in a falling rates/deflationary environment, and it’s one of the reasons that gold is the ultimate all-weather asset and currency.
Having said that, to consistently attract Western mainstream money managers and retail investors to gold, inflation, war, and other fear-oriented themes need to be in play.
With natural gas, oil, and gasoline languishing, fears of inflation are quickly diminishing.
Western governments have numbed their citizens to the horrors of the Ukraine war and turned many of them into cheerleaders for more wars (so long as they don’t have to fight in the wars themselves).
War worshippers aren’t afraid, so they don’t buy gold. Instead, they buy the stock market, and on that note…
(Click on image to enlarge)
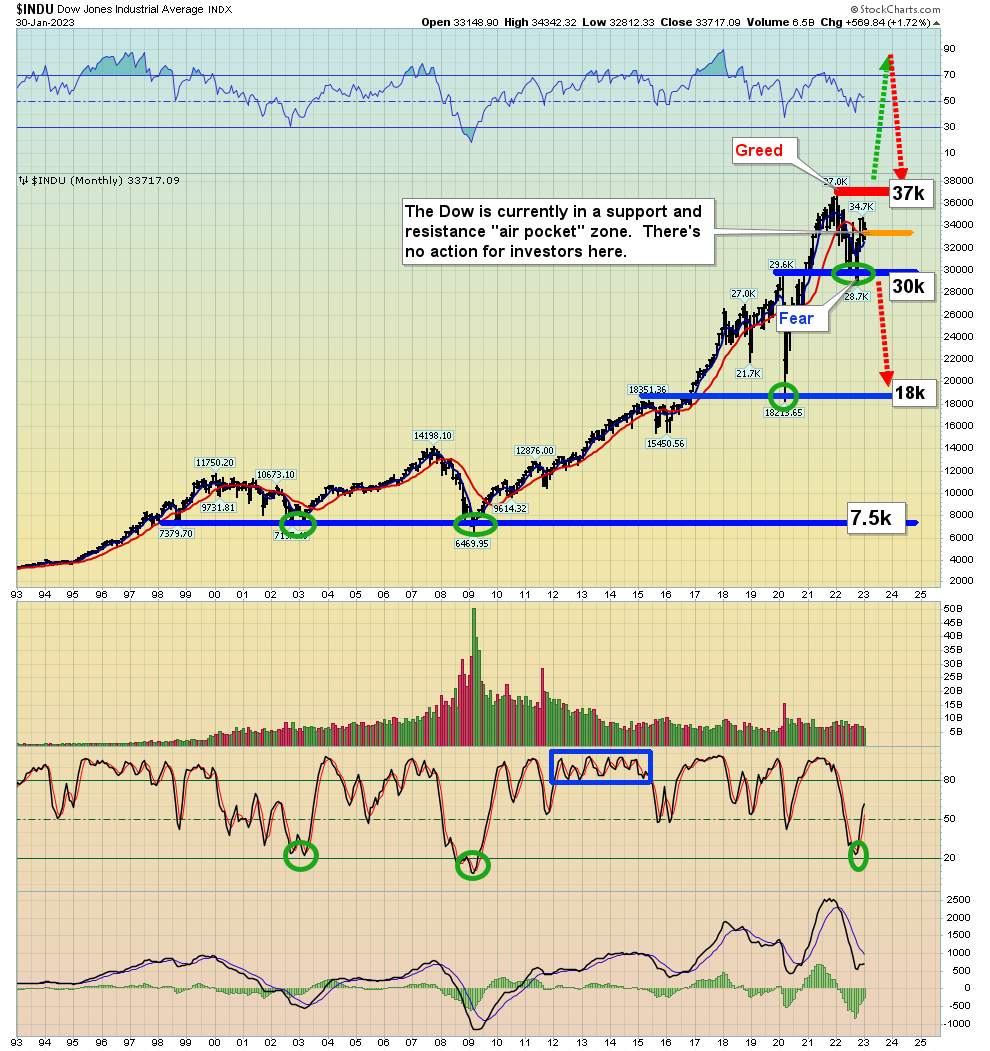
The Dow is not in a big investor greed zone where there is often a rise in inflation. It’s not in a big fear zone where the Fed could turn dovish.
It’s in an area that is neutral for the price of gold.
Tactics for mining stock investors?
(Click on image to enlarge)

GDX versus gold chart
Since 2013, the miners have been in a huge base pattern. A breakout doesn’t appear to be imminent, but the maturity of the pattern suggests it could happen by Q3 or Q4 this year.
(Click on image to enlarge)

This GDXJ daily chart has a massive C&H (cup and handle) pattern forming. A pullback now would create symmetry in the pattern, if it ends at $34-$35.
The C&H target is $70-$80.If the Fed’s actions and statements tomorrow are negative for gold, my $1808 buy zone becomes likely to happen. If the Fed is “more dovish than expected”, and Euro growth continues to strengthen (boosting the euro vs USD), then $1880 may be as deep as this gold price reaction goes!
More By This Author:
Gold Stock Race Cars On A Bull Era Track
Gold At $1925: Key Investor Tactics
A Speaker Listens As Gold Glistens


