
The glory of gold. In a world ravaged by debt, fiat, and war… is it a time for gold bugs of the world to be bold?
It certainly is, but first I’d like both gold bugs and stock market bugs to look at the US stock market, which has devolved into a macabre poster boy for the destruction of millions of Main Street citizens of America.
Gone are the days of the 1950s, when a rise in the purchasing power of the poor and middle earners was the basis for higher stock prices. Today’s money managers act like ogres, feeding on the “joy” of massive layoffs, crushed GDP, and foreign slave labor while begging for central bank soup kitchen handouts.

With the QE and negative rates central bank soup kitchen closed down, and US stock market investors cheering the current Dow and SP500 rally look like snails on a Chinese stock market race track. They need to get off the track.
For a closer look at the situation:
(Click on image to enlarge)
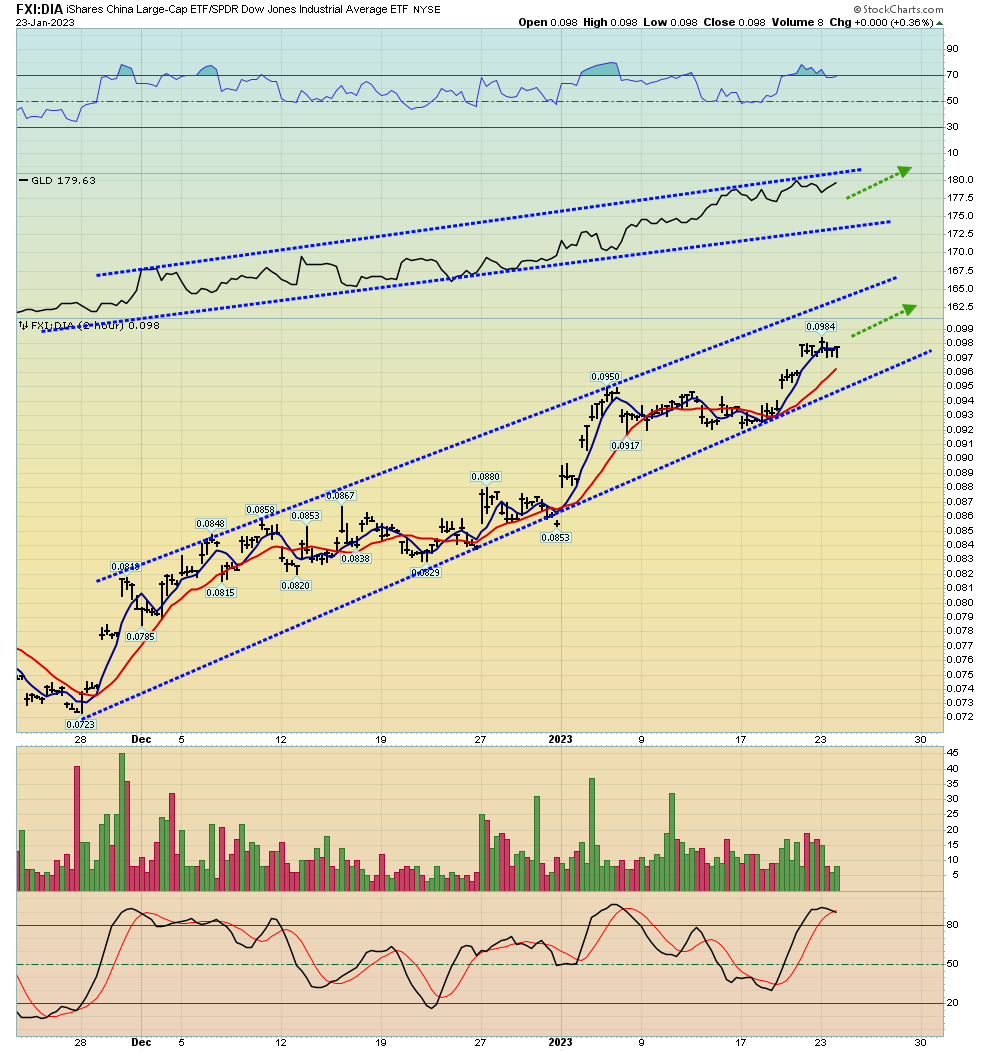
ratio chart of the Chinese FXI versus the US Dow.
At the top of the chart is the GLD gold ETF. Even with the Chinese gold and stock markets closed this week for the “Golden Week” holiday, the upside action for the FXI (and gold!) continues.
My strongest suggestion for US stock market bugs is to get some Chinese market exposure and exposure to India. The bottom line: size matters and 3 billion Chindians is a lot of size… size that is also oriented around gold.
What about silver?
(Click on image to enlarge)

Silver is more volatile than gold and has failed to keep pace with gold since 1980.
Silver is currently priced at about half its 1980 highs of $50, and gold is about double its highs of about $900. Having said that, if investors buy silver at my buy-side HSR zones for gold, the rallies from there (like the current one from $1610) tend to handily outperform gold.
HSR is horizontal support and resistance. I urge investors to focus on HSR of size on the weekly and monthly charts. Another suggestion I have for silver investors is to look at the price only once a day or once a week. There’s no need to get dragged into the emotional churning that comes with a volatile asset like silver.
The world is in the throes of a five-year war cycle, empire transition, woke worship gone off the rails, and many other major themes that are incredibly beneficial for ultimate money that is called… gold.
Tactics?
(Click on image to enlarge)
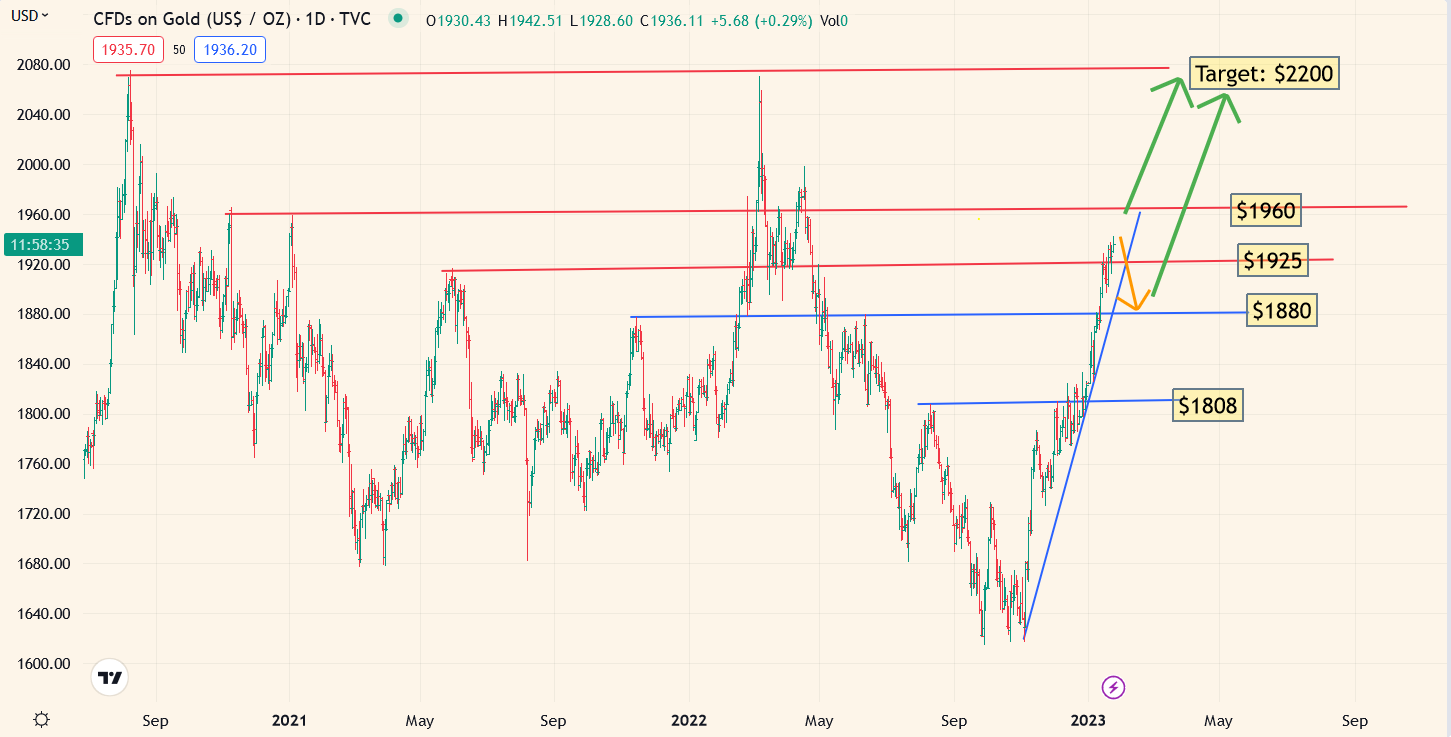
Sell-side HSR zones are marked in red. These are prices where gold’s advance against fiat may pause or begin a reaction.
This morning’s mighty blast higher through $1925 and on towards $1960 is making $1880 into a buy zone. I’m selling 20% of my GDX and associated miners into this massive rally, not to call a top, but simply to book some very juicy profits. Here’s the bottom tactical line:
If gold stocks fall hard soon after an investor books trading position profit, their core positions fall hard too, and the investor barely got out of their trading positions before the market got hammered. That’s not an emotionally stable life on the metals market grid lines. A stable life looks something like this:
Tactically, investors should want the market to continue higher after they sell. At some point, the market will correct, but the higher the price is before that happens, the richer that investors with core positions will be. Those core positions will be solidly in the black even at the lows of a reaction.
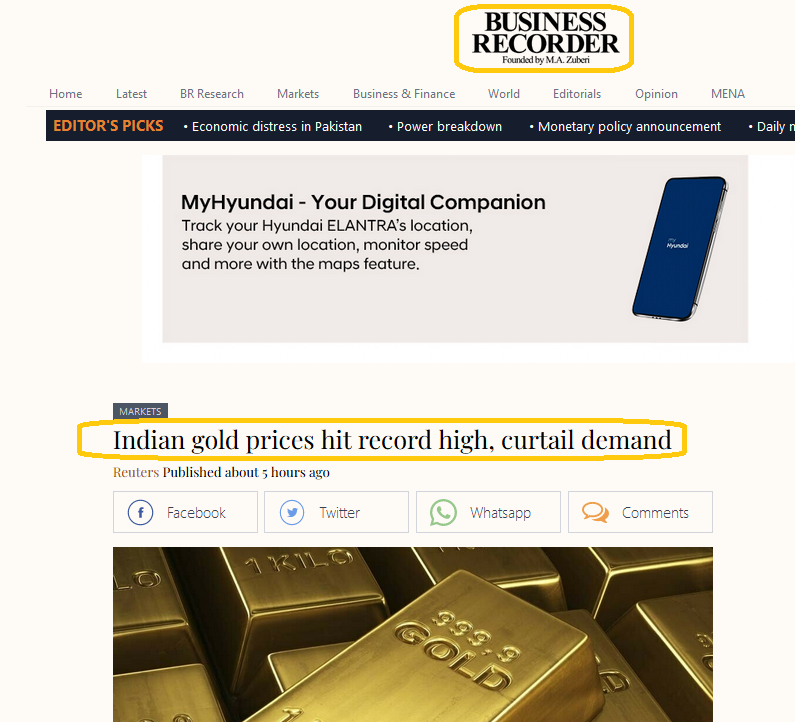
Western media is good at noting a fade in Indian demand on huge gold price rallies, but they aren’t very good at noting the enormous addition to Indian gold-oriented core position wealth that is created by these rallies.
Western gold bugs can learn a lot from Indian “titans of ton”. The main theme of a gold price rally is not projecting what’s next. Simply put, it’s all about modest profit booking… and enjoying a big core position ride!
For a look at some base metal mining stock action:
(Click on image to enlarge)
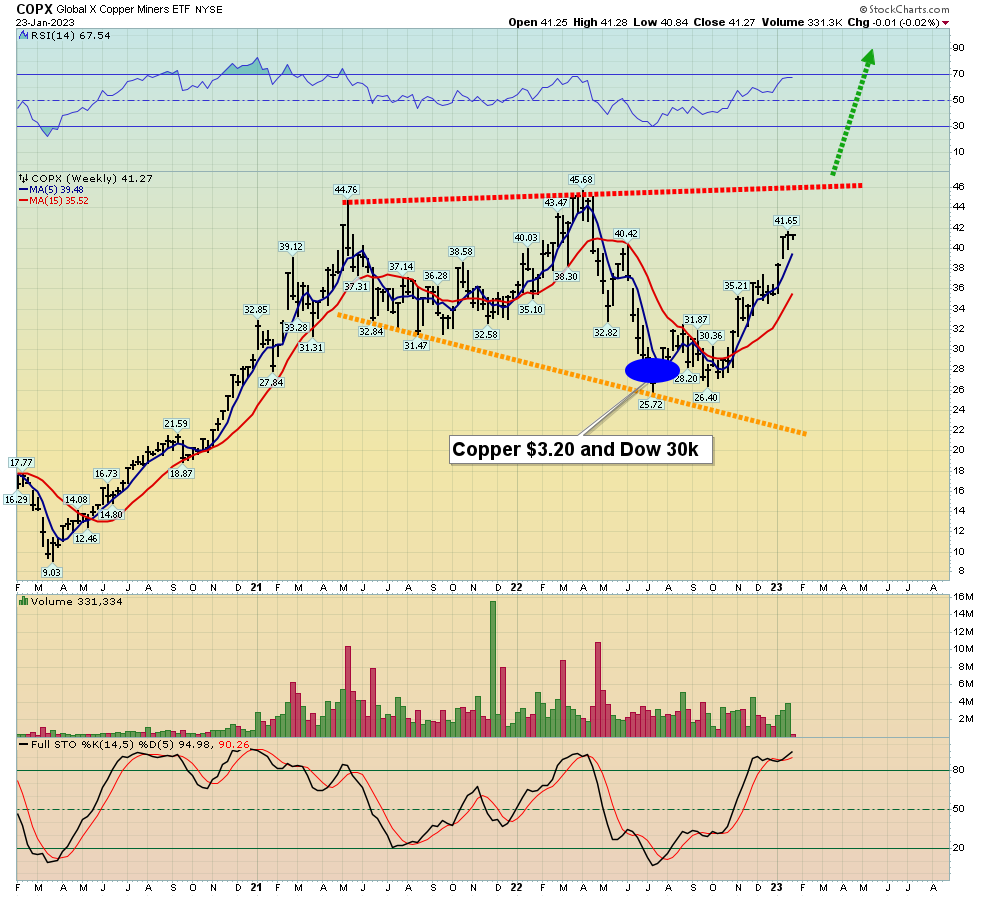
COPX copper stocks chart.
I urged copper stock investors to buy COPX and related stocks as copper hit $3.20. Now an enormous broadening formation is in play. The flattish top of the pattern suggests the breakout will be to the upside.
Next:
(Click on image to enlarge)
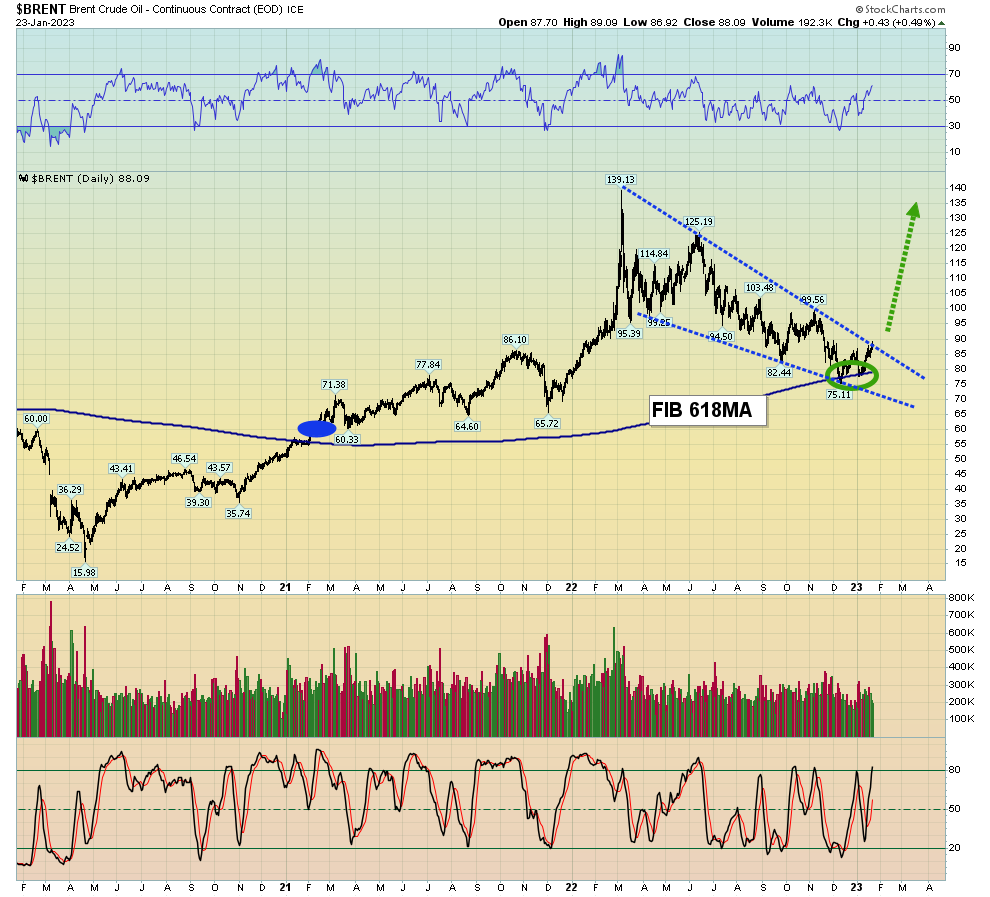
stunning Brent oil price chart.
Previously, I highlighted a huge bull wedge pattern on the WTIC (West Texas Intermediate Crude) chart, and the Brent wedge is even more impressive.
Note the bounce from the 618-day moving average, which is a key Fibonacci number. Goldman analysts are forecasting a near 50% rally in the oil price for 2023. They call the Chinese economy opening a game changer for commodities. Technically, the Brent chart is in perfect sync with their fundamentals-oriented forecast.
A fresh wave of oil and copper-themed inflation seems imminent. Will Western money managers begin to embrace gold stocks and ETFs like GDX and GDXJ if that inflation materializes? I’ll suggest the answer is: Yes.
On that note:
(Click on image to enlarge)

GDXJ chart.
An expanding saucer formation showcases the price action.
(Click on image to enlarge)
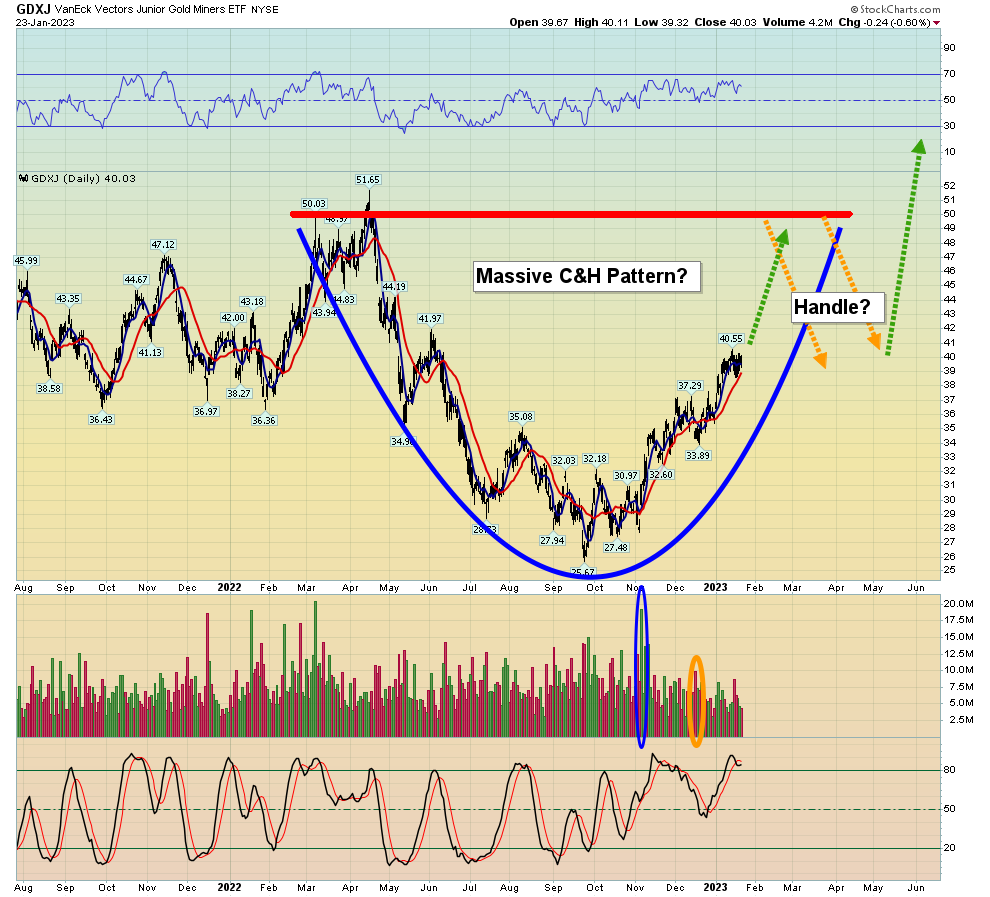
One scenario becoming more plausible is that a huge C&H (cup and handle) is taking shape on the GDXJ chart.
The price target is $75, and the action in copper stocks and oil suggests the target is not only possible but highly likely to become just a pitstop for gold stock race cars… on a bull-era racetrack!
More By This Author:
Gold At $1925: Key Investor TacticsA Speaker Listens As Gold Glistens
Gold: Investor Tactics For 2023


Comments
Log in or sign up to join the conversation.