
Gold Outlook

- Hawkish Fed keeps spot gold dejected while USD rallies.
- U.S. retail sales data dominates the economic calendar today.
- XAU/USD trades at key area of confluence.
XAU/USD Fundamental Backdrop
Gold looks to test July swing lows today after yesterday’s U.S. inflation ‘hangover effect’ seems to have dissipated. The U.S. dollar is bid once more weighing negatively on bullion due to renewed market anticipation of a large interest rate hike by the Federal Reserve next week. Money markets have even gone so far as to increase the probability of a 100bps rate hike to 30%!
FED Interest Rate Probabilities
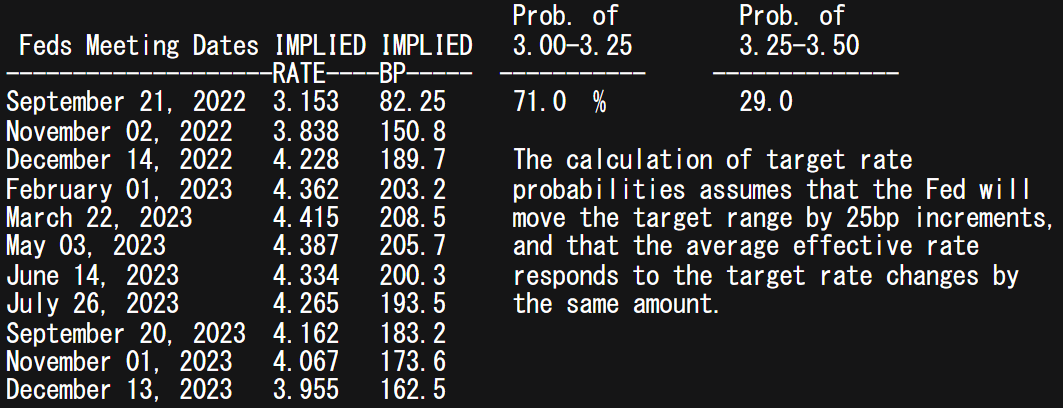
Source: Refinitiv
Upcoming U.S. data points could contribute to adding to a more hawkish announcement with today’s retail sales data and industrial production (see economic calendar below). Any beat in actual data could keep the dollar elevated thus maintaining downward pressure on spot gold.
Economic Calendar

Source: DailyFX Economic Calendar
We can see the impact of the U.S. inflation beat by way of real yields (see graphic below) which have reached yearly highs this week. The higher real yield figure is ominous for gold as the opportunity cost of holding gold increases which theoretically exposes bullion to further downside. If markets are tipped into a recession which is highly likely, gold’s safe haven draw may help alleviate some weakness but for now my outlook remains bearish until such time as the Fed looks to alter its policy stance.
U.S. 10-Year TIPS (Yield)

Source: Refinitiv
Technical Analysis
Gold Price Daily Chart

Chart prepared by Warren Venketas, IG
Gold price action on the daily chart above shows the 38.2% Fibonacci support level at 1682.29 under threat but more importantly the July swing low at 1680.95. Should bears manage to push prices below 1680.95 we may see subsequent support zones come into consideration.
While the Relative Strength Index (RSI) may be exhibiting bullish divergence, I deem this too early to call with much time before the week’s session closes.
Resistance levels:
- 20-day EMA (purple)
- 1700.00
Support levels:
- 1682.29 (23.6%)
- 1667.67 (August 2021 swing low)
Gold Price Weekly Chart
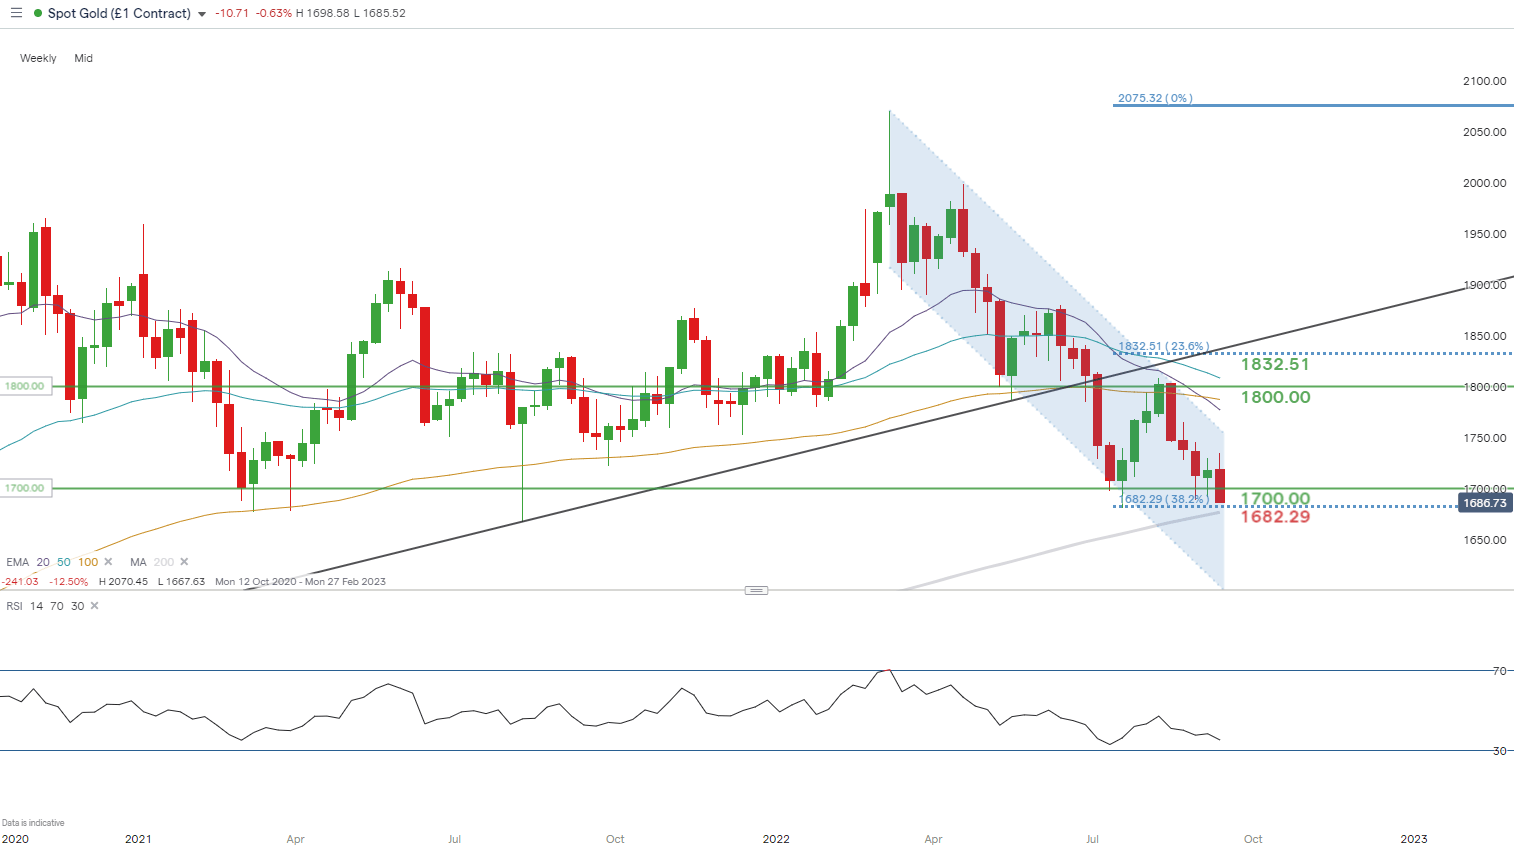
Chart prepared by Warren Venketas, IG
The weekly XAU/USD chart holds the key in my opinion with the last 2 weekly candles begin unable to close below the psychological $1700. If this week’s close happens to buck the trend, a large selloff may ensue. A move lower will also bring into focus the 200-day SMA (grey) which will be closely monitored to see whether or not bears can break this key area of significance.
More By This Author:
Japanese Yen Short-Term Technical Outlook: USD/JPY Rally VulnerableCrude Oil Prices Gain Amid USD Softness, Bulls Eye Key Trendline Resistance
S&P 500 And Nasdaq 100 Sink As High Inflation Bolsters Case For Hawkish Fed


Comments
Log in or sign up to join the conversation.