
U.S. stocks plummeted on Tuesday, hit by a surge in U.S. Treasury yields sparked by worse-than-expected U.S. inflation data. The decline on Wall Street was broad-based, but the consumer discretionary and information technology sectors bore the brunt of the sell-off in a session characterized by heightened risk aversion and volatility across most assets.
When it was all said and done, the S&P 500 sank 4.32% to 3,933, reaching its lowest level since last Wednesday and suffering its largest drop since June 2020. Meanwhile, the Nasdaq 100 plunged 5.54% to 12,034, its worst day since March 2020, with heavy-hitters Apple, Microsoft, and Amazon falling 5.84%, 5.48%, and 7.03%, respectively, at the closing bell.
The catalyst that triggered the brutal slump was the August consumer price index report, released in the morning by the U.S. Bureau of Labor Statistics. According to the agency, the headline CPI rose 0.1% m-o-m and 8.3% y-o-y, two-tenths of a percent above consensus forecasts. The core gauge also surprised to the upside by a similar margin, up 0.6% m-o-m and 6.3% y-o-y.
Today's CPI results suggest that price pressures are not weakening at the desirable pace, a sign that the Federal Reserve will have no choice but to continue to raise borrowing costs forcefully in the coming months to rebalance demand with supply in the economy. The aggressive monetary policy outlook is likely to exacerbate the current slowdown, increasing the risks of a hard landing.
On the fixed income side, rates surged on the day, with the 2-year yield climbing more than 20 basis points to 3.77%, its highest level since October 2007. Although the benchmark 10-year yield also soared, its advance was more measured, deepening the inversion of the 2s10s curve, an ominous signal for the economy. Meanwhile, the implied yield on Fed futures also repriced higher for most tenors, with traders now discounting a terminal rate of 4.32% in April 2023, 36 basis points above the morning low.
2023 Fed Futures Contracts Chart (Implied Yield)
(Click on image to enlarge)
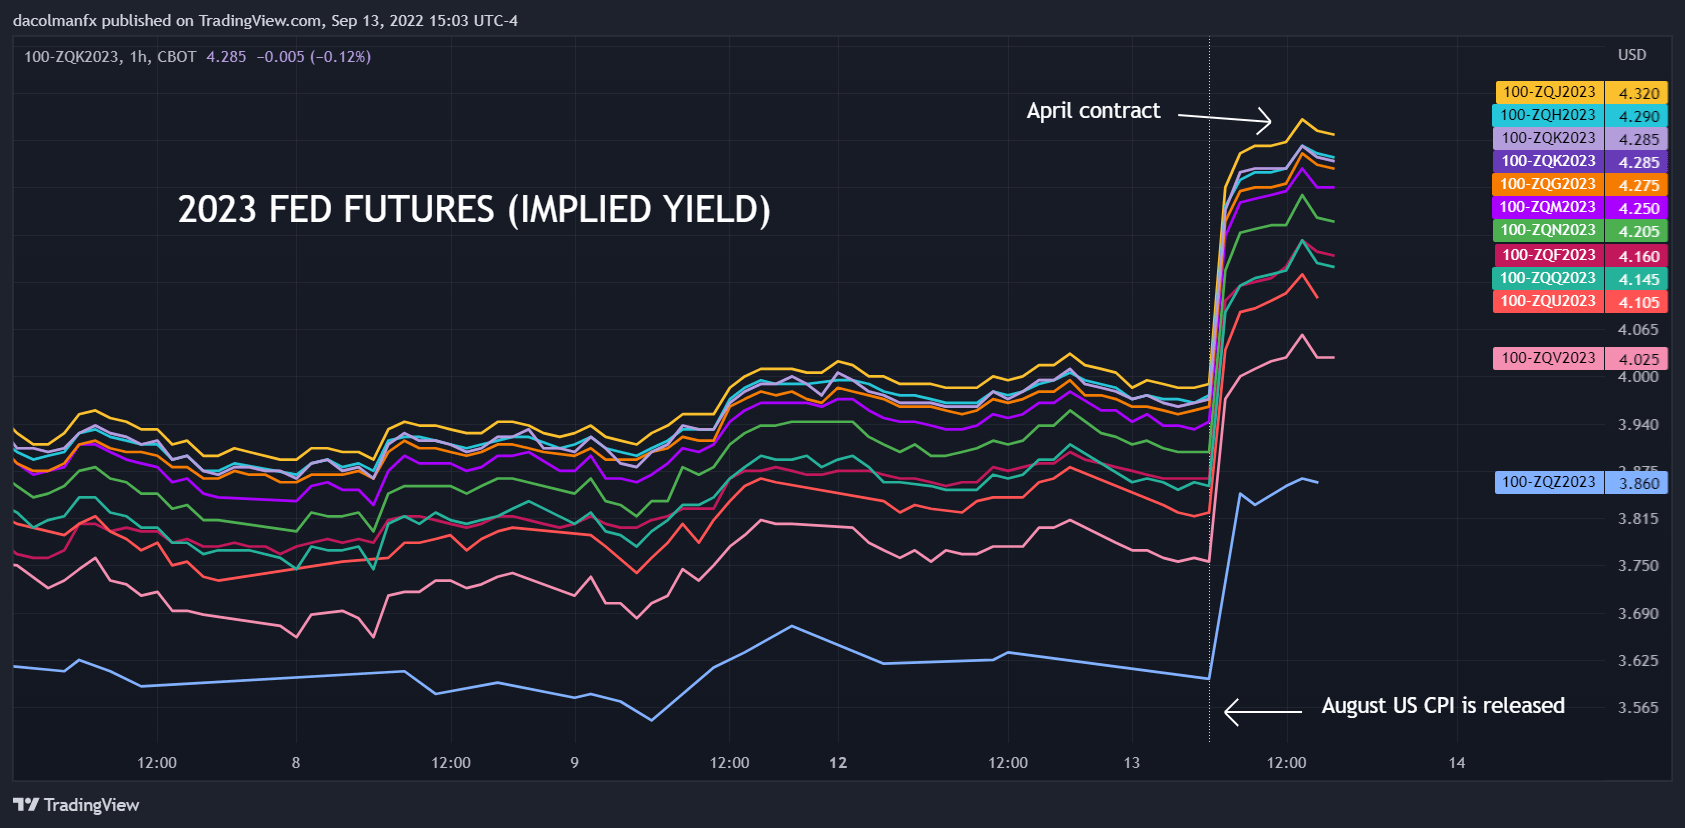
Source: TradingView
Financial conditions are likely to tighten significantly in the coming days and weeks to account for more aggressive interest rate hike expectations and the reduced likelihood of a policy pivot in 2023. In this environment, stocks will struggle to make a meaningful and lasting recovery, particularly those in the tech and growth space (see a possible explanation here). This means that the S&P 500 and Nasdaq 100 may be tilted to the downside in the near term.
S&P 500 Technical Outlook
The S&P 500 nosedived Tuesday, erasing most gains since last Wednesday. Following this sharp drop, the index is approaching important support near the 3,900 area, where the September lows converge with a short-term rising trendline extended from the 2022 lows. If sellers manage to breach this key floor in the coming days, sentiment could worsen markedly, reinforcing the negative market dynamics and paving the way for a slide towards 3,815.
On the flip side, if dip-buyers resurface unexpectedly and spark a reversal to the upside, initial resistance comes in at 4,055. On further strength, the focus shifts to 4,120, followed by 4,175.
S&P 500 Technical Chart
(Click on image to enlarge)
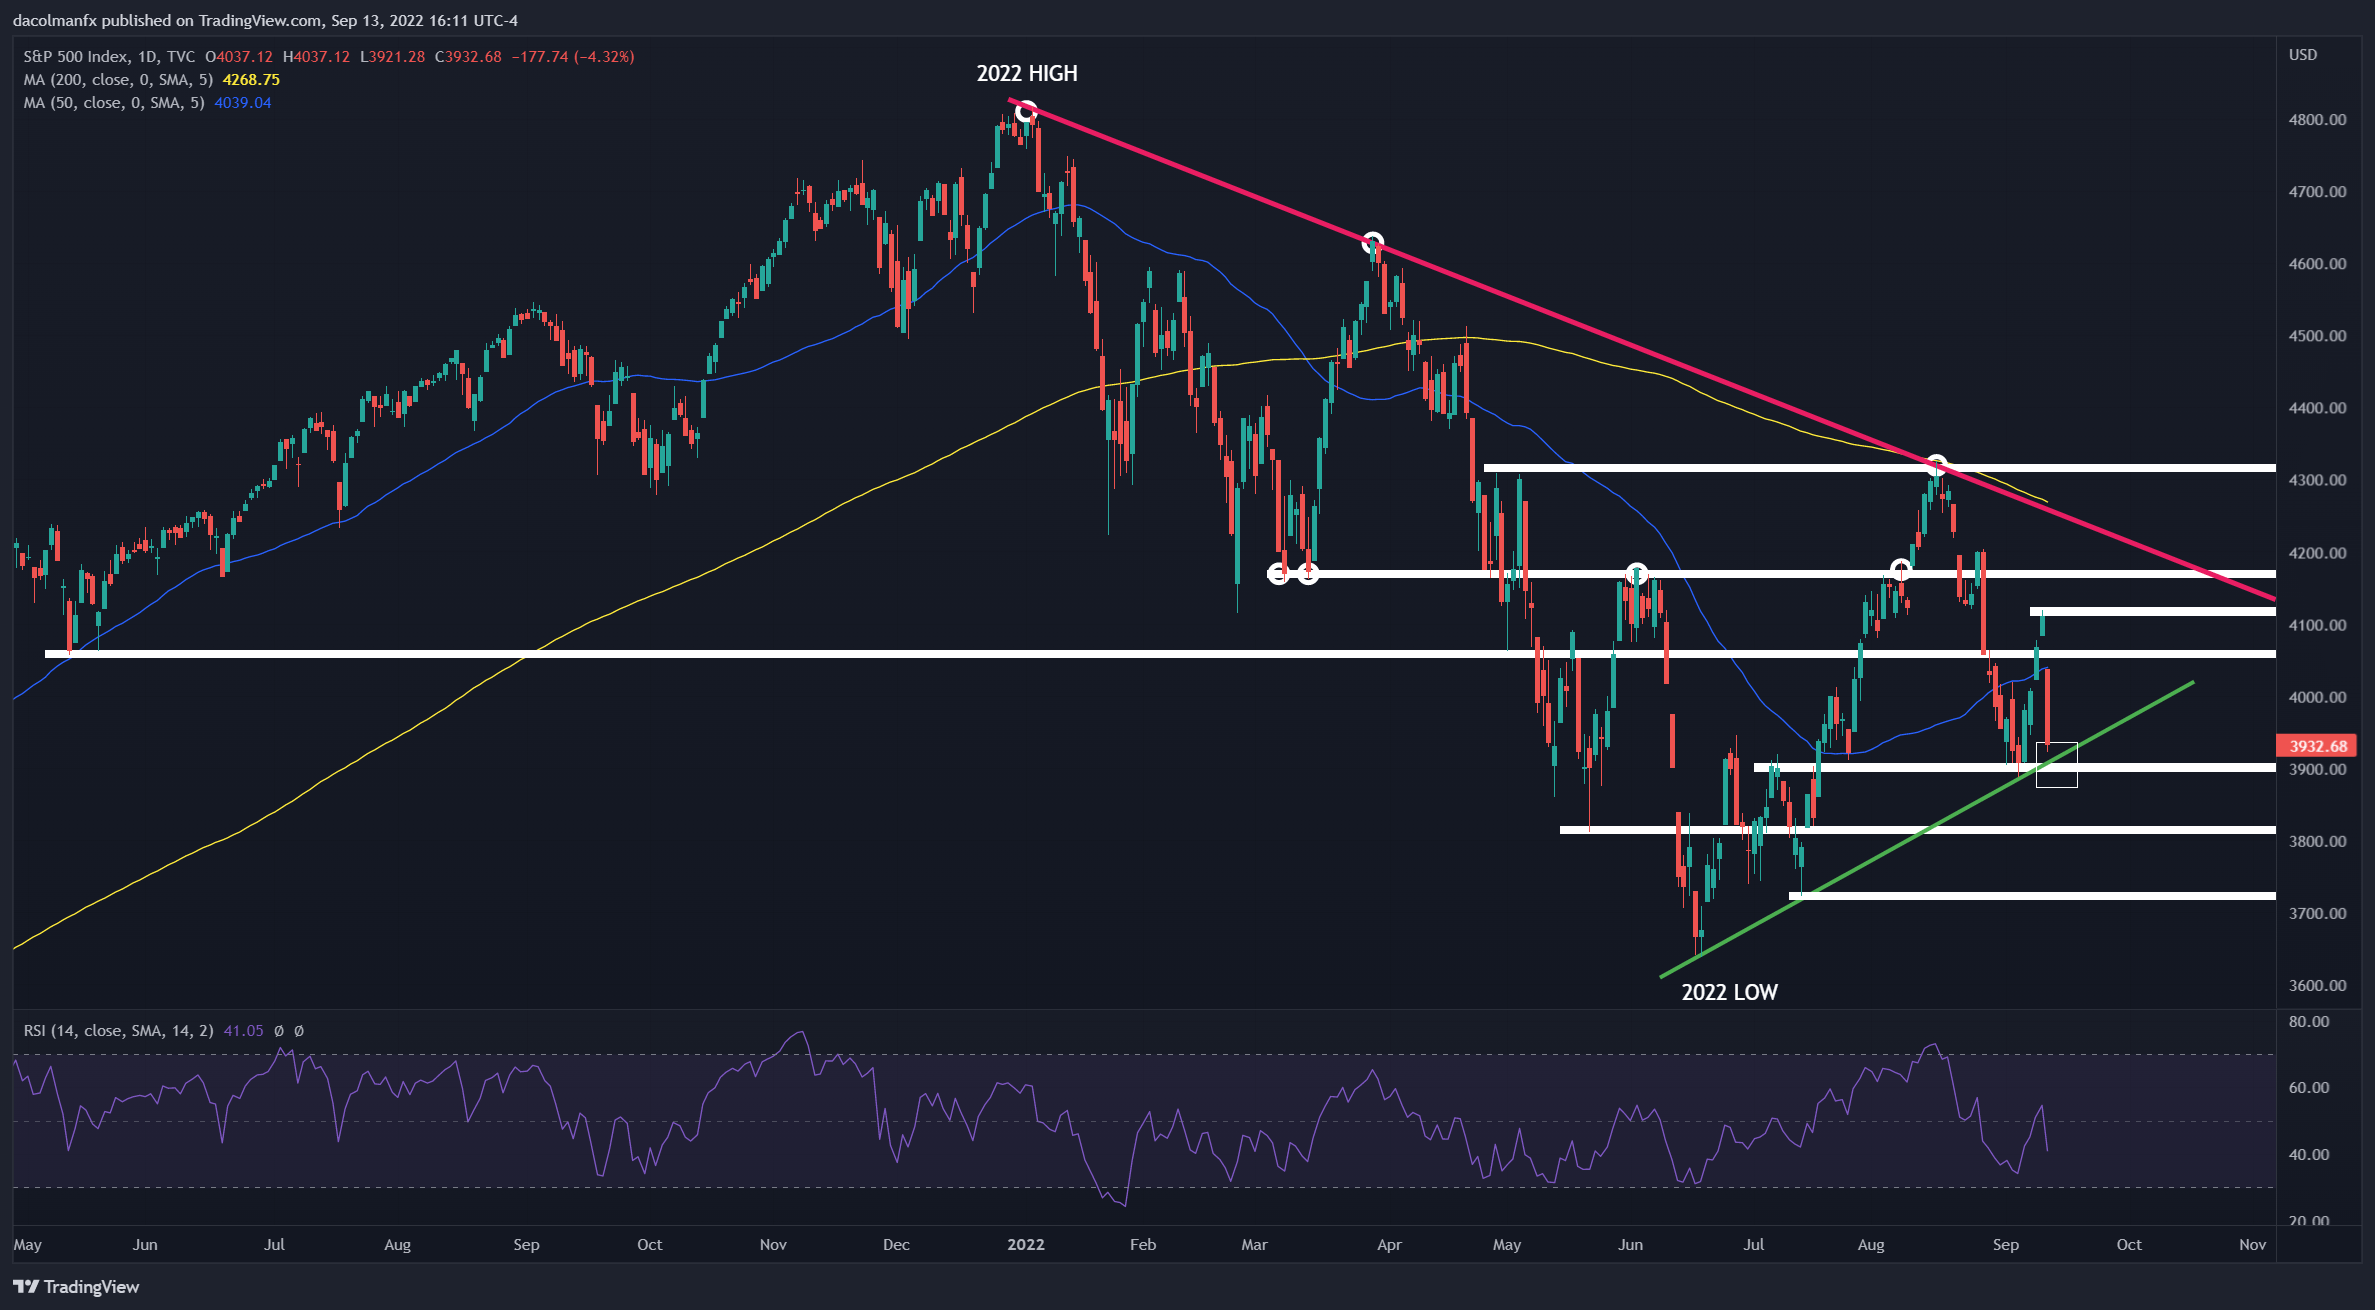
S&P 500 Chart Prepared Using TradingView
More By This Author:
US Dollar Price Action Setups: EUR/USD, GBP/USD, USD/CAD, JPY/USD
Japanese Yen Struggles As More Officials Fret Its Weakness
Euro Forecast: EUR/USD Soars As Dollar Loses Sparkle Ahead Of US Inflation Report


Comments
Log in or sign up to join the conversation.