
Friday of last week saw a notable counter-trend move in the US Dollar. Prices had just pushed below a key point of prior resistance, running from around 109.14-109.27, and this was helped along by a bullish push in EUR/USD the day after the ECB’s 75 bp hike.
That pullback in USD continued through yesterday’s trade and into this morning, with price finding support around the 107.79 area on the chart. This was a prior price action swing that was resistance-turned-support and it helped to bring bulls into the matter again this morning, with DXY jumping back above the 110 handle.
This puts bulls back in the driver’s seat and that area of prior resistance around 109.14-109.27 now becomes higher-low support potential. If that doesn’t hold, there’s another spot a little deeper, around support-turned-resistance at 108.38.
US Dollar Two-hour Price Chart
(Click on image to enlarge)
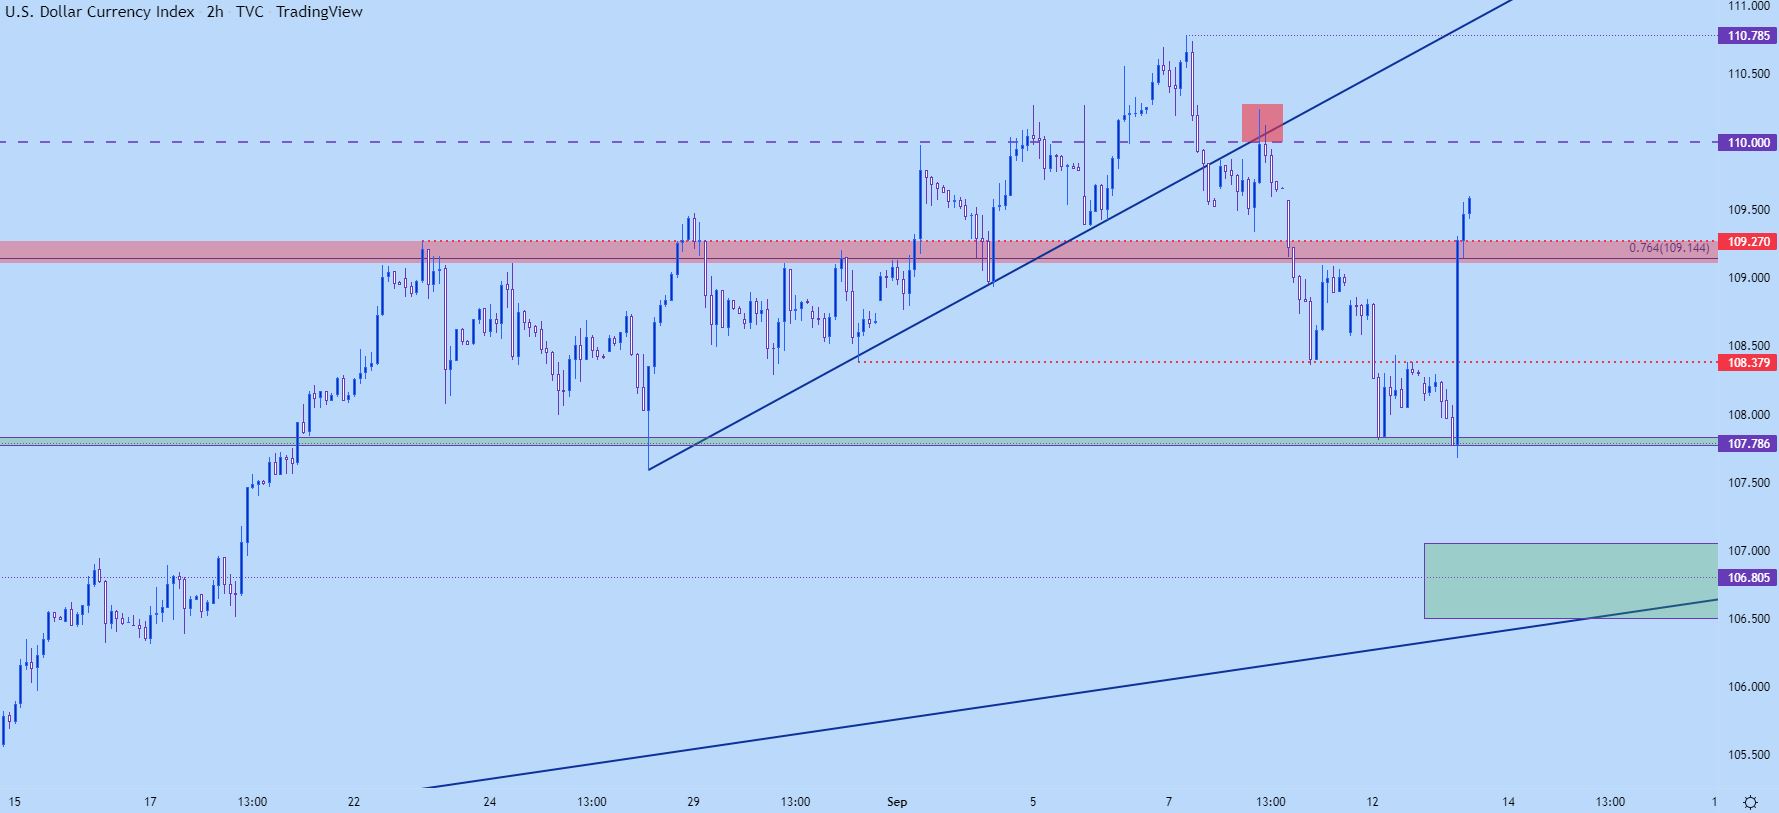
Chart prepared by James Stanley; USD, DXY on Tradingview
US Dollar Longer-term
Bigger picture, the question is whether bulls are ready for a test at the 110 handle. This was a big spot last week and we only saw one daily close above – which was quickly followed by a bearish engulf on Wednesday.
The current 20-year-high is up at 110.79 so if buyers can really stretch that becomes a waypoint of interest, but the bigger question is the next test at 110. From the above chart, you can see the resistance inflection at 110, which was confluent with a trendline at the time. Will sellers defend this level again and related – will EUR/USD bulls defend the support at .9950 or perhaps even .9900?
In my opinion, the more orchestrated the move – the better. If we do see some element of higher-low support building ahead of that 110 re-test or perhaps even the 110.79 re-test, the more attractive continuation themes become.
At this point, the daily bar of DXY is working on a bullish engulf which points to the prospect of topside trend continuation potential.
US Dollar Daily Chart
(Click on image to enlarge)
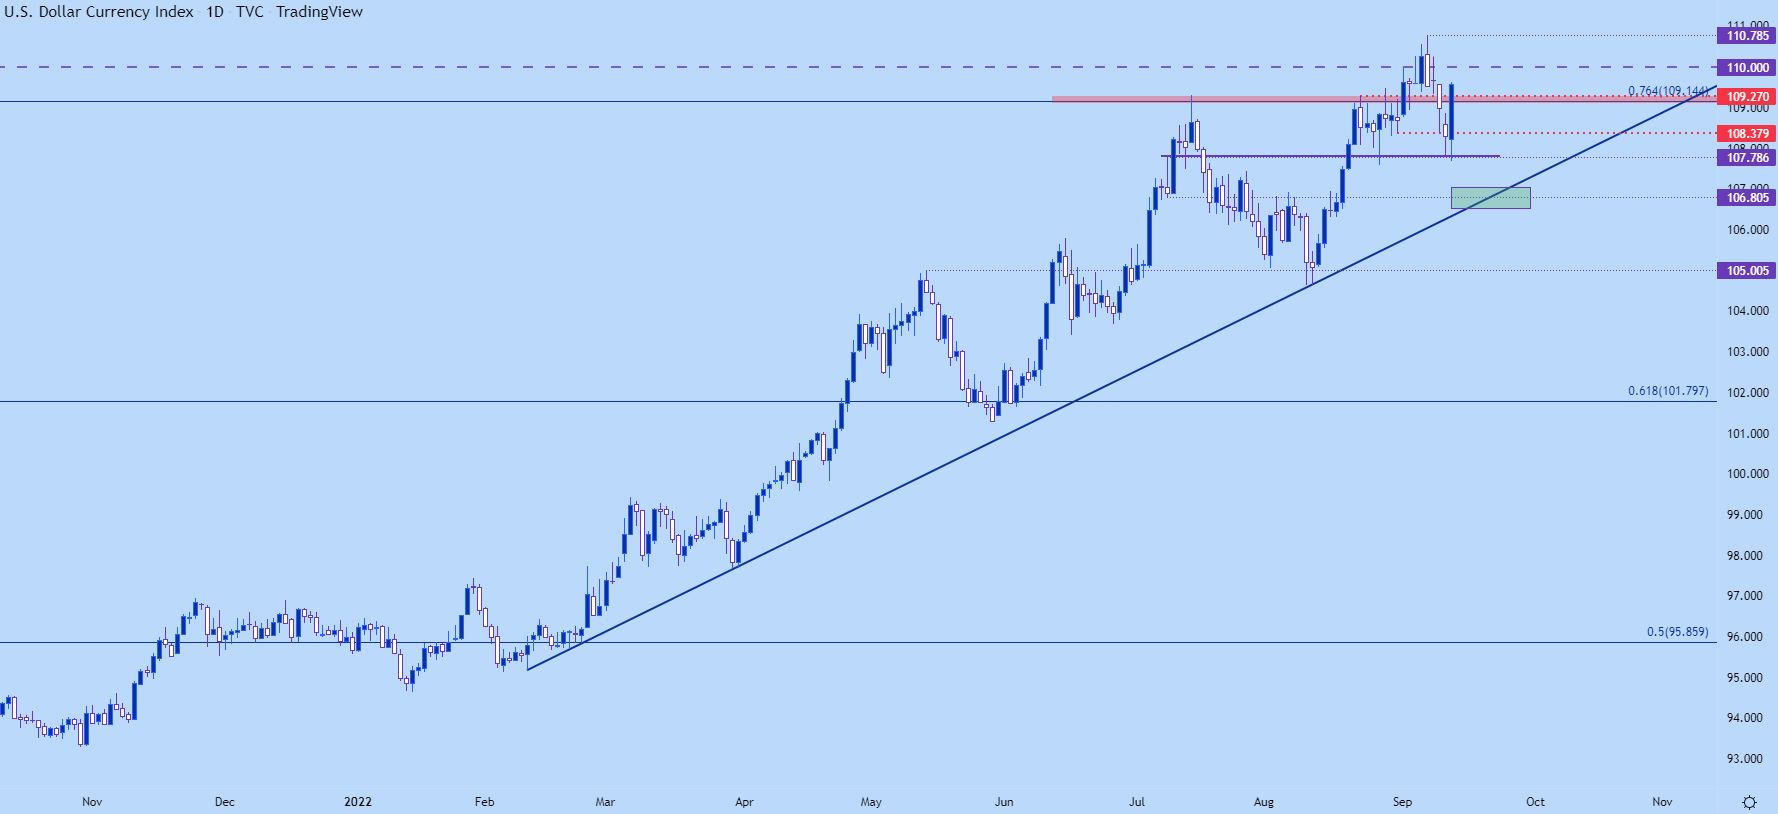
Chart prepared by James Stanley; USD, DXY on Tradingview
EUR/USD Another Round At Parity
As USD strength has come roaring back, so has EUR/USD weakness.
The pair was in a vulnerable state last week when I looked at it after the ECB meeting. The ECB rate hike of 75 basis points didn’t really get priced-in until Friday, after EUR/USD had found support at prior falling wedge resistance. And in the early portion of this week that bullish short-term trend continued.
It’s now been flipped on its head after this CPI print and EUR/USD is right back at the parity handle, grasping for support.
EUR/USD Daily Price Chart
(Click on image to enlarge)
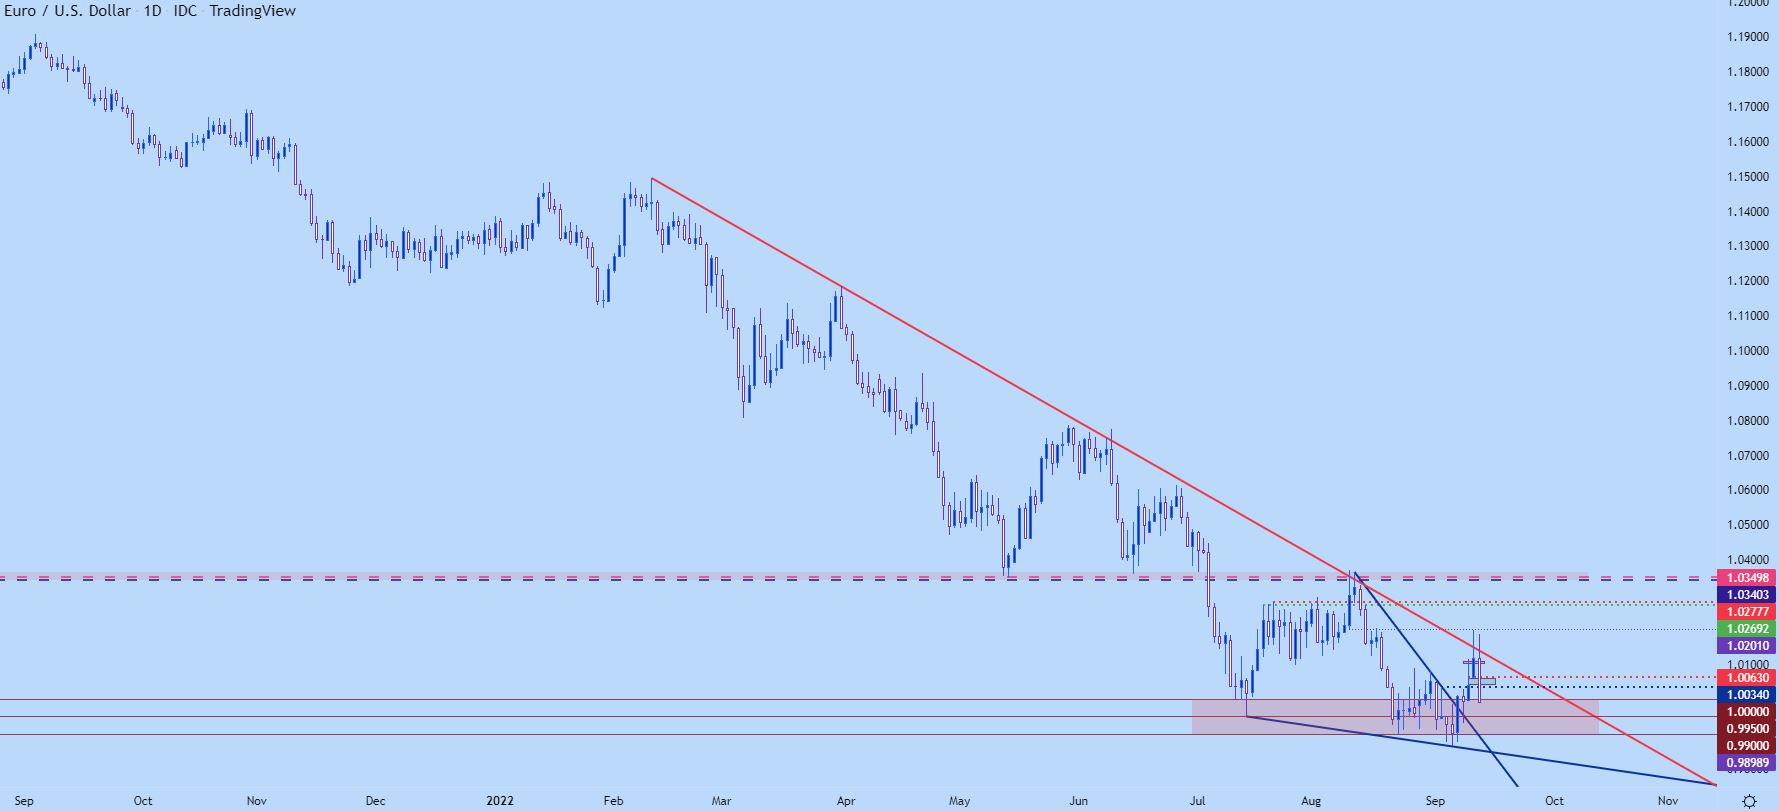
Chart prepared by James Stanley; EURUSD on Tradingview
EUR/USD Short-term
EUR/USD is now back in the zone that sellers had a difficult time leaving behind. This is what helped to create the falling wedge that led to the bullish breakout. The big question now is whether sellers will be able to pose a break below the lows.
At this point, bears have made a pronounced re-entry into the situation and this can keep the door open for shorter-term momentum strategies. Prior points of support, such as 1.0034 or 1.0063 can now be re-purposed as resistance potential. The next item of support on my chart is around the .9950 area after which the .9900 level comes into play. A break of .9862 is a fresh 20-year-low and that keeps the door open for bearish breakout strategies.
EUR/USD Four-hour Price Chart
(Click on image to enlarge)
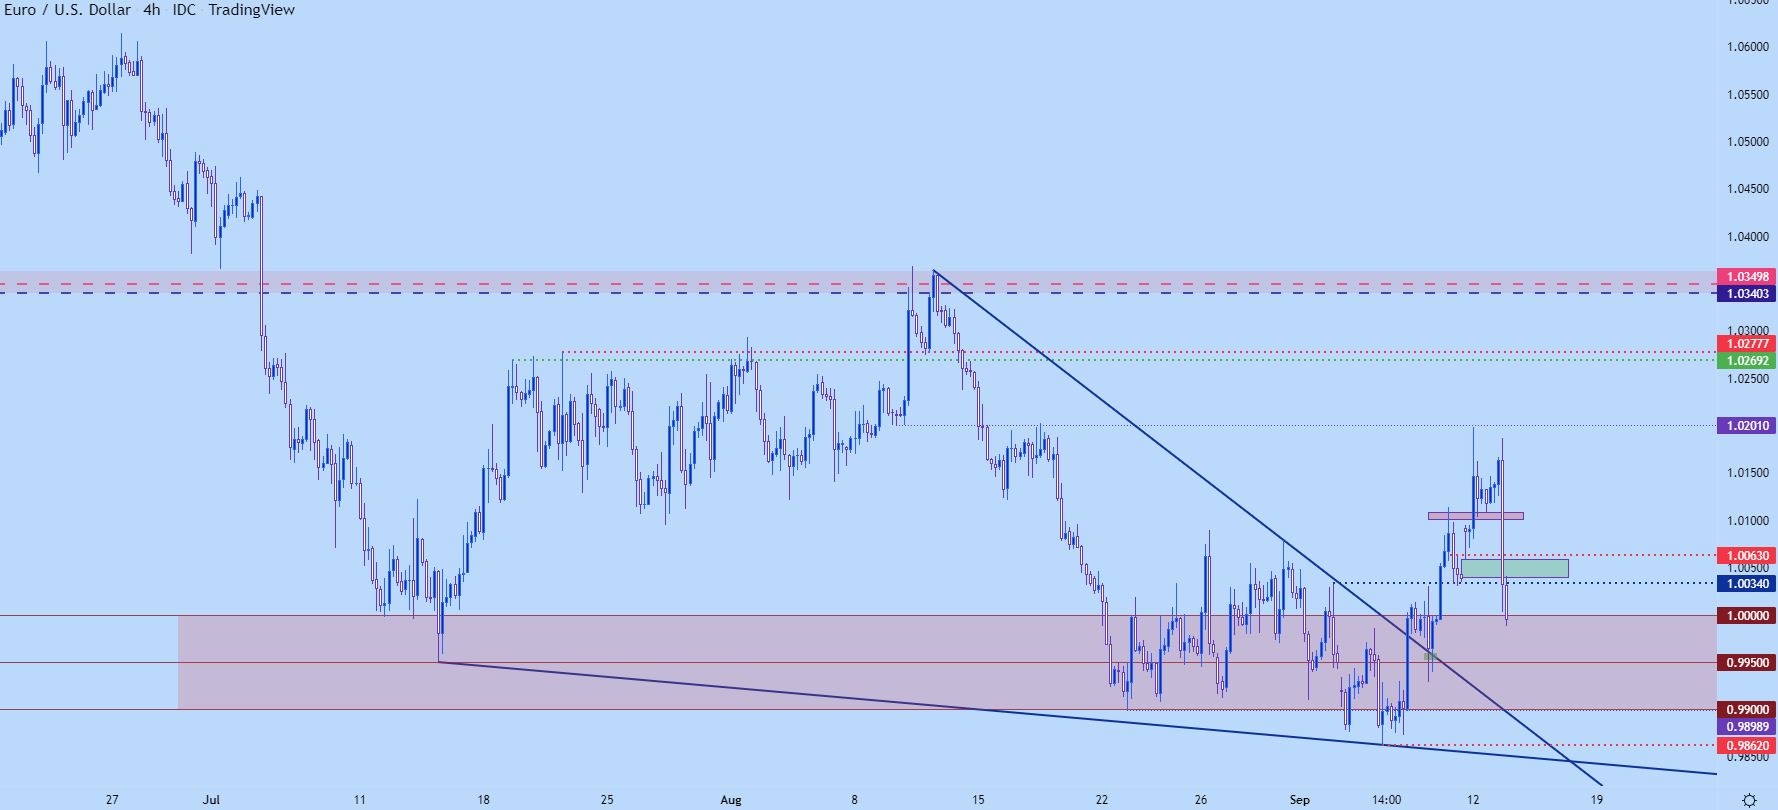
Chart prepared by James Stanley; EURUSD on Tradingview
GBP/USD
This was another recovery move that’s been brought into question after this morning’s CPI print. GBP/USD had made a strong run at the 1.1750 resistance that I was talking about on Friday. And we’re now re-approaching the 1.1500 psychological level which helped to bring on the bounce at the end of last week.
Today’s daily bar is currently working on a bearish engulfing, so the stage is set for another showdown at the 1.1500 level. If sellers can penetrate, the look then goes to the 1.1404-1.1414 level that helped to mark the fresh 37-year low last week.
As I had looked at in this week’s British Pound Technical Forecast, GBP/JPY may hold more interest for those with bullish GBP biases. That pair is now very near a key point of resistance at 168.06.
GBP/USD Daily Chart
(Click on image to enlarge)
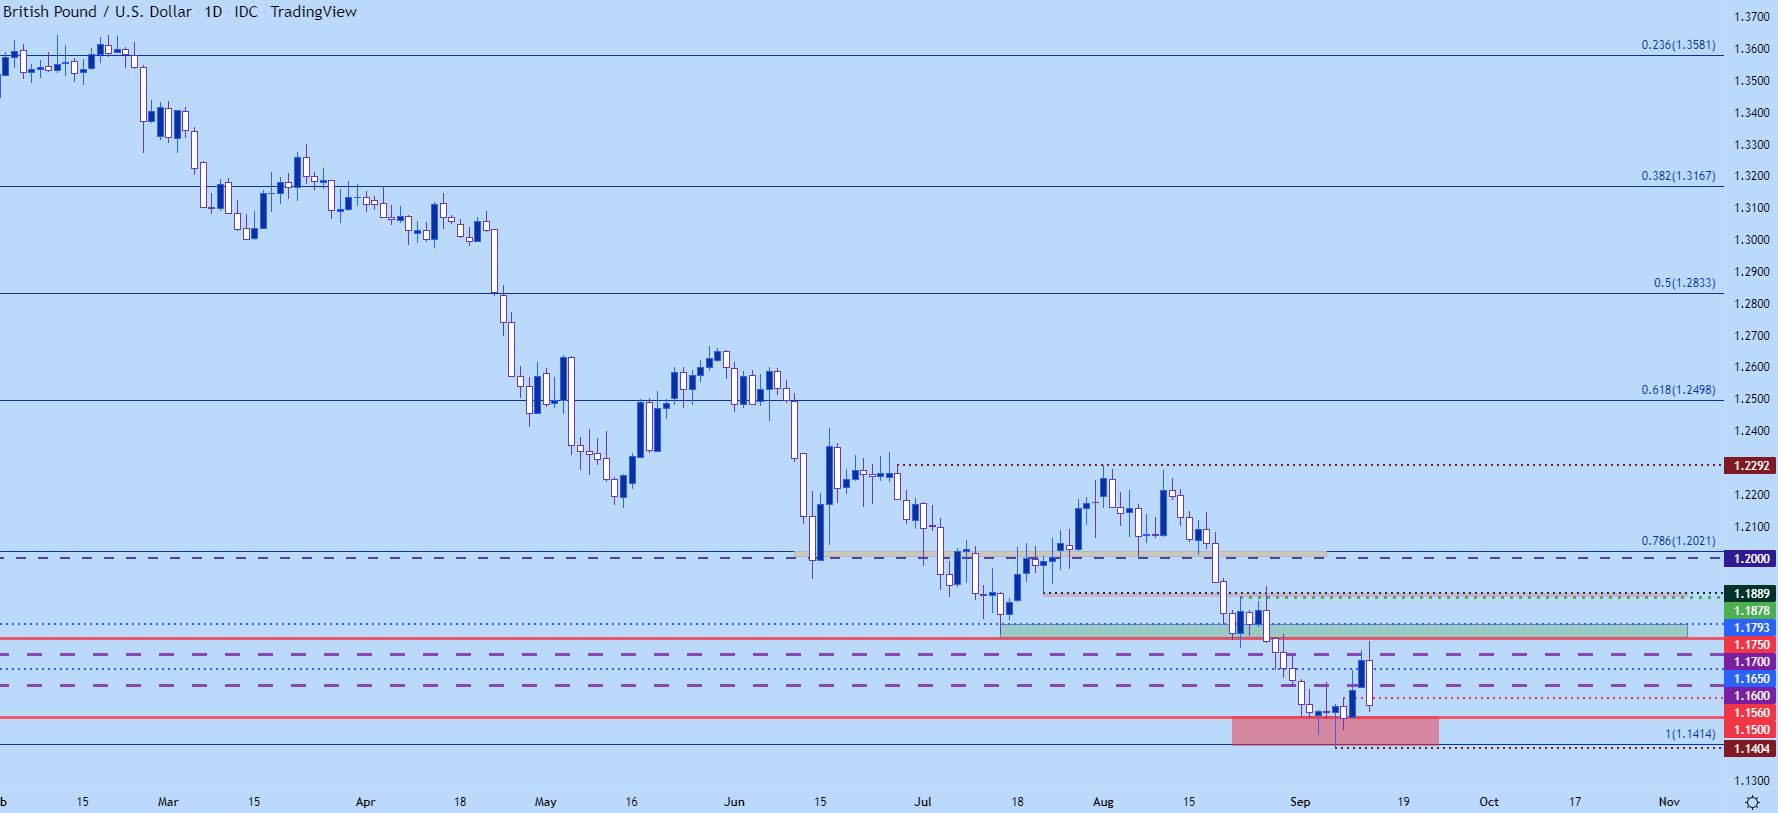
Chart prepared by James Stanley; GBPUSD on Tradingview
USD/CAD
I’ll keep this one longer term as that’s where my interest is on USD/CAD at the moment. Price is putting in a large pivot today along with USD trends but the more notable item in my mind is where this is taking place on the chart, around the 1.3000 psychological level. And longer-term, there’s a remaining bear flag in play.
Notably, the pair failed to test the high over the prior two weeks, with a sizable sell-off developing after the second failed attempt last week. That led to a fresh multi-week low but bulls have made up quite a bit of ground so far this morning.
This setup up for bullish breakout potential should the price continue all the way up for a re-test of that yearly high around 1.3224. But – if bulls fail to re-test that high watermark, we have another lower high, and that’s something that could lead to bearish themes with a bit of continued development.
Like GBP/USD above, the daily chart is working on an engulf pattern so I would be very careful of plotting for a reversal right after that prints. But, this would be something to watch over the next couple of days. If breakout, bullish potential remains up to the 50% mark of the 2020-2021 move. If lower-high, the look goes back to a re-test of 1.3000 and perhaps even 1.2950.
USD/CAD Weekly Chart
(Click on image to enlarge)
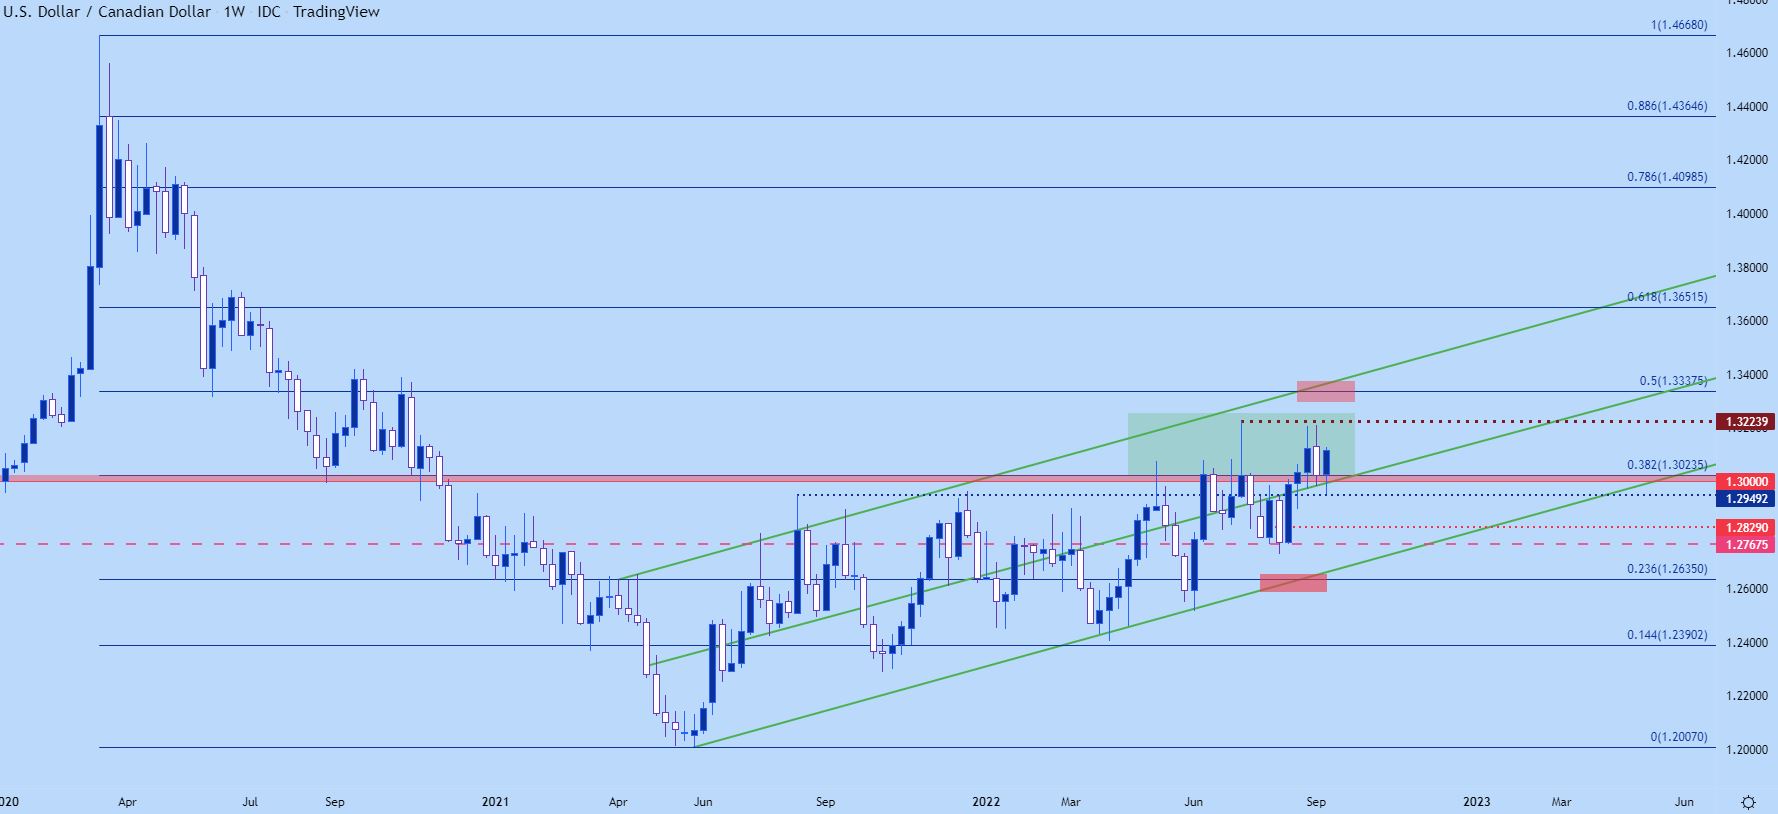
Chart prepared by James Stanley; USDCAD on Tradingview
USD/JPY
With rates rallying on the back of this CPI print, we’ve seen both a USD strength and Japanese Yen weakness.
USD/JPY came very close to hitting the 145.00 psychological level last week, falling just about a pip shy of testing the big figure. And what started as a pullback started to get a bit of interest for reversal themes, with support ultimately coming in around 141.50.
This morning’s knee-jerk move has catapulted price back up to the region where price action really put in some grind after that failed run at 145.00. This runs from around 144.21-144.39. And given recent dynamics, there’s a spot of key support plotted around support-turned-resistance at 143.29.
From a formation perspective – it can even be argued that a double-bottom is at work, although there was variance of about 11-12 pips from those swing lows, so it would really depend on how technical you wanted to get about it (it is ‘technical’ analysis, after all). But – from that look, there would be approximately 200 pips from the bottom to the neckline, which would put a 200 pip resistance target above the neckline – which projects to around 145.50.
USD/JPY Two-hour Price Chart
(Click on image to enlarge)
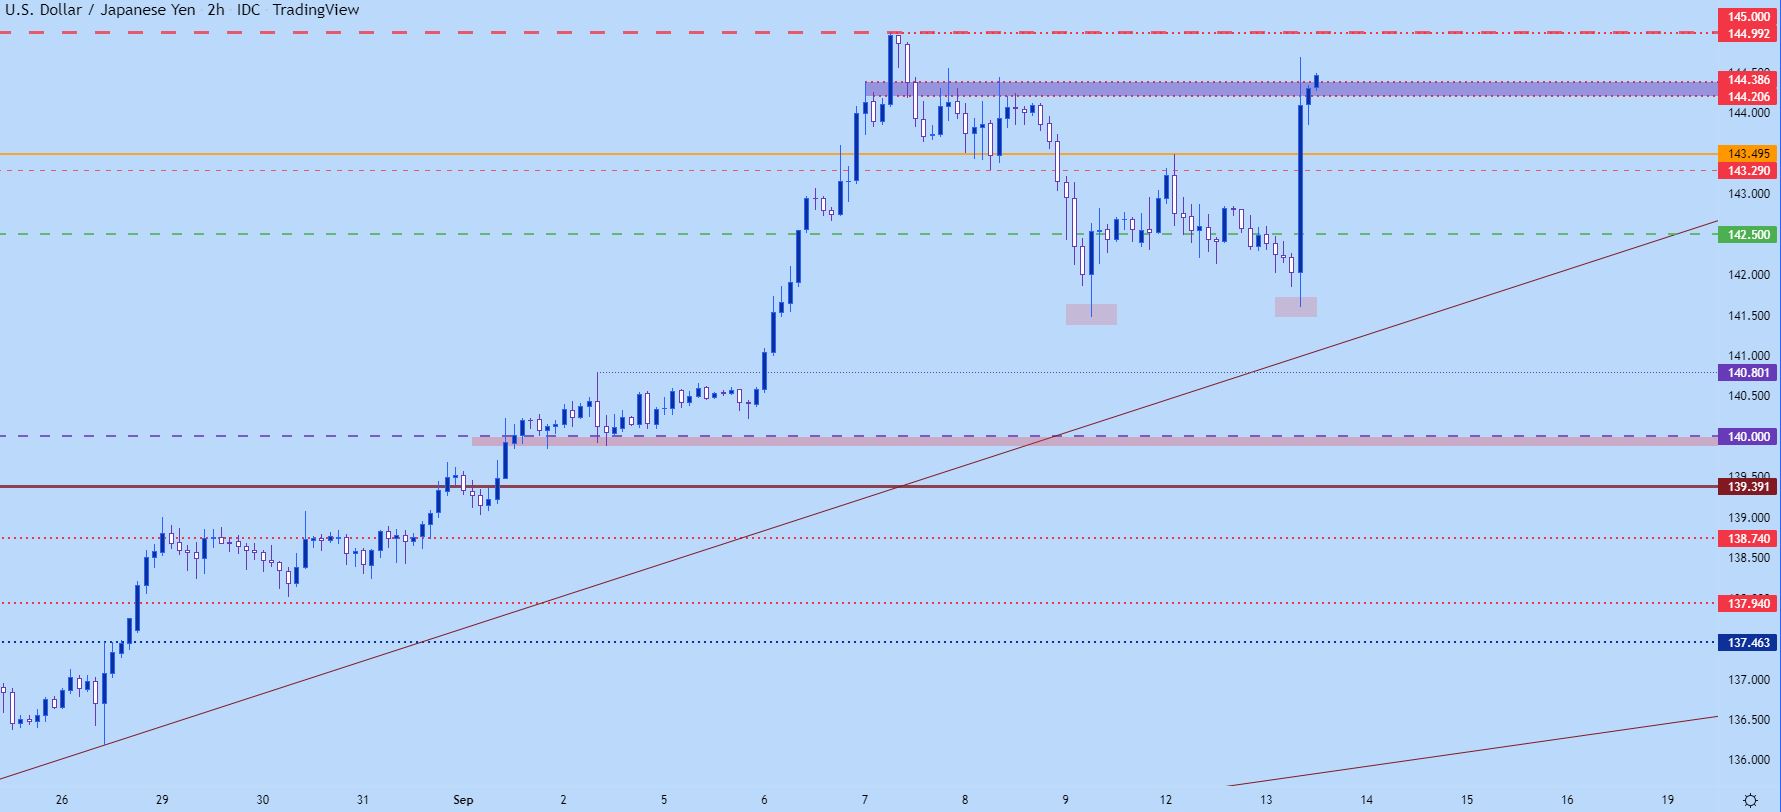
Chart prepared by James Stanley; USDJPY on Tradingview
More By This Author:
Japanese Yen Struggles As More Officials Fret Its Weakness
Euro Forecast: EUR/USD Soars As Dollar Loses Sparkle Ahead Of US Inflation Report
US Dollar Price Action Setups - EUR/USD, GBP/USD, USD/CAD, USD/JPY


Comments
Log in or sign up to join the conversation.