
Oil prices rose on Wednesday amid U.S. dollar softness in the currency market, extending their recovery that began last week after bouncing off long-term trendline support and a key Fibonacci retracement level located in the $82.00 area. At one point in the trading session, WTI crude was up about 3.4% to $90.2, its best level since September 6, but then trimmed some of those gains to trade slightly above $89.00 per barrel.
From a price action standpoint, bulls still have some reasons to be concerned. First off, oil has been making lower highs and lower lows since June, a negative sign for the commodity. At the same time, we have seen the formation of a death cross on the daily chart, a pattern typically viewed as bearish by technical analysts.
To be confident that the downward correction that has unfolded over the past few months has come to an end, we need more positive technical signals to develop. One of these, and perhaps a significant one, could come from a higher high that takes out the August peak, but we are still far from that point: one day at a time for now.
Oil Key Technical Levels
In any case, oil prices seem to be approaching a pivotal resistance near the $91.00 handle after the recent advance, a ceiling created by a descending trendline in play for three months. If we see a clear move above this barrier in the coming days, breakout traders could jump back in, reinforcing upside momentum and launching an attack on the 200-day simple moving average. On further strength, the focus shifts to the August swing high at $97.66, the line in the sand that may determine the near-term trend.
On the flip side, if sellers, speculating on the weak economic outlook and increased uncertainty, resurfaced to trigger a bearish reversal, initial support sits at $85.50. If this floor is breached on weekly closing prices, the next one to watch appears around the $82.00 region, as mentioned above. If the bulls fail to defend this zone, sentiment could quickly worsen, paving the way for a pullback toward the $78.00 area.
WTI Crude Oil Technical Chart
(Click on image to enlarge)
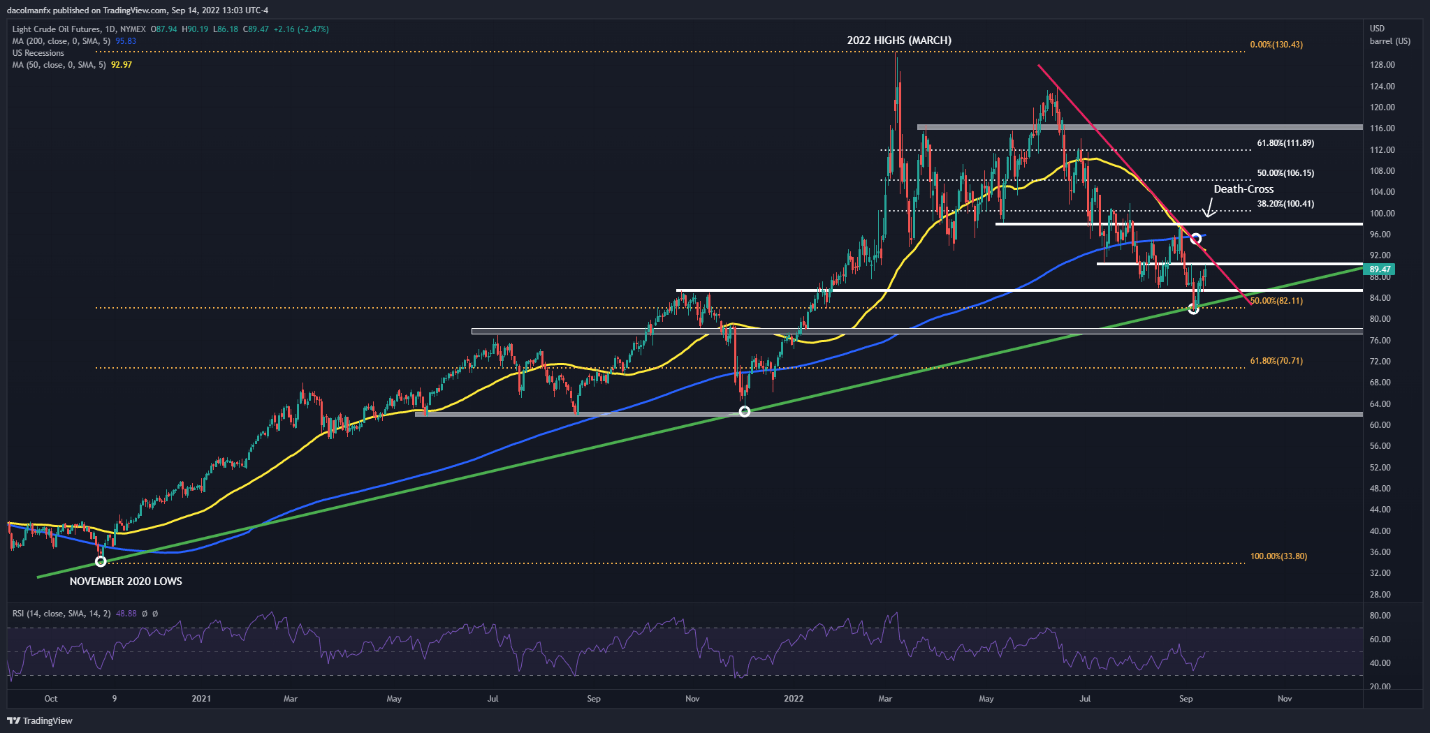
WTI Oil Chart Prepared Using TradingView
More By This Author:
S&P 500 And Nasdaq 100 Sink As High Inflation Bolsters Case For Hawkish FedUS Dollar Price Action Setups: EUR/USD, GBP/USD, USD/CAD, JPY/USD
Japanese Yen Struggles As More Officials Fret Its Weakness


Comments
Log in or sign up to join the conversation.