

Image Source: Pixabay
Gold (XAUUSD) is gaining support from a mix of favorable economic signals and global developments. July’s inflation data eased policy concerns and boosted expectations for Fed rate cuts. A weaker US Dollar and an extended trade truce also helped improve market sentiment. Even with rising optimism in equity markets, gold prices remain stable. The metal now trades within a key technical pattern, awaiting a clear breakout signal.
Fed Policy Signals and CPI Data Strengthen Gold's Outlook
Gold found strength following the release of July’s CPI report. Headline inflation remained steady at 2.7%, matching expectations. Core inflation came in stronger than expected, hitting 3.1%. On a monthly basis, headline inflation increased by 0.2% and core inflation by 0.3%, matching forecasts. These figures eased concerns about persistent inflation and supported the outlook for easier monetary policy.
The Federal Reserve may consider cutting rates in September. Signs of a weakening labor market reinforce this possibility. According to CME FedWatch, markets are pricing in two rate cuts by the end of the year. A dovish Fed tends to weaken the US Dollar, which in turn supports non-yielding assets, such as gold. At the same time, global trade developments added to the positive sentiment. President Trump extended the tariff truce with China for three more months, reducing trade tensions. The upcoming US-Russia summit is expected to support diplomatic progress, which will add pressure on the Dollar and lift sentiment.
Still, gold’s rally lacks strong momentum. Global stock markets are reaching record highs, signaling a shift toward a risk-on sentiment. The S&P 500 and Nasdaq reached new closing peaks, while Japan’s Nikkei broke above the 43,000 mark for the first time. These equity gains may limit the upside for safe-haven assets, such as gold. Investors now await comments from Fed officials, which could influence expectations for future policy. Attention will soon turn to the US PPI and University of Michigan Consumer Sentiment Index for further insight into inflation and consumer strength.
Gold Consolidation in Triangle Points to Imminent Breakout
The gold chart below shows a symmetrical triangle forming on the weekly time frame. This pattern indicates consolidation after a strong move. It reflects a temporary balance between buyers and sellers. In this case, gold has been coiling inside this triangle for months.
(Click on image to enlarge)
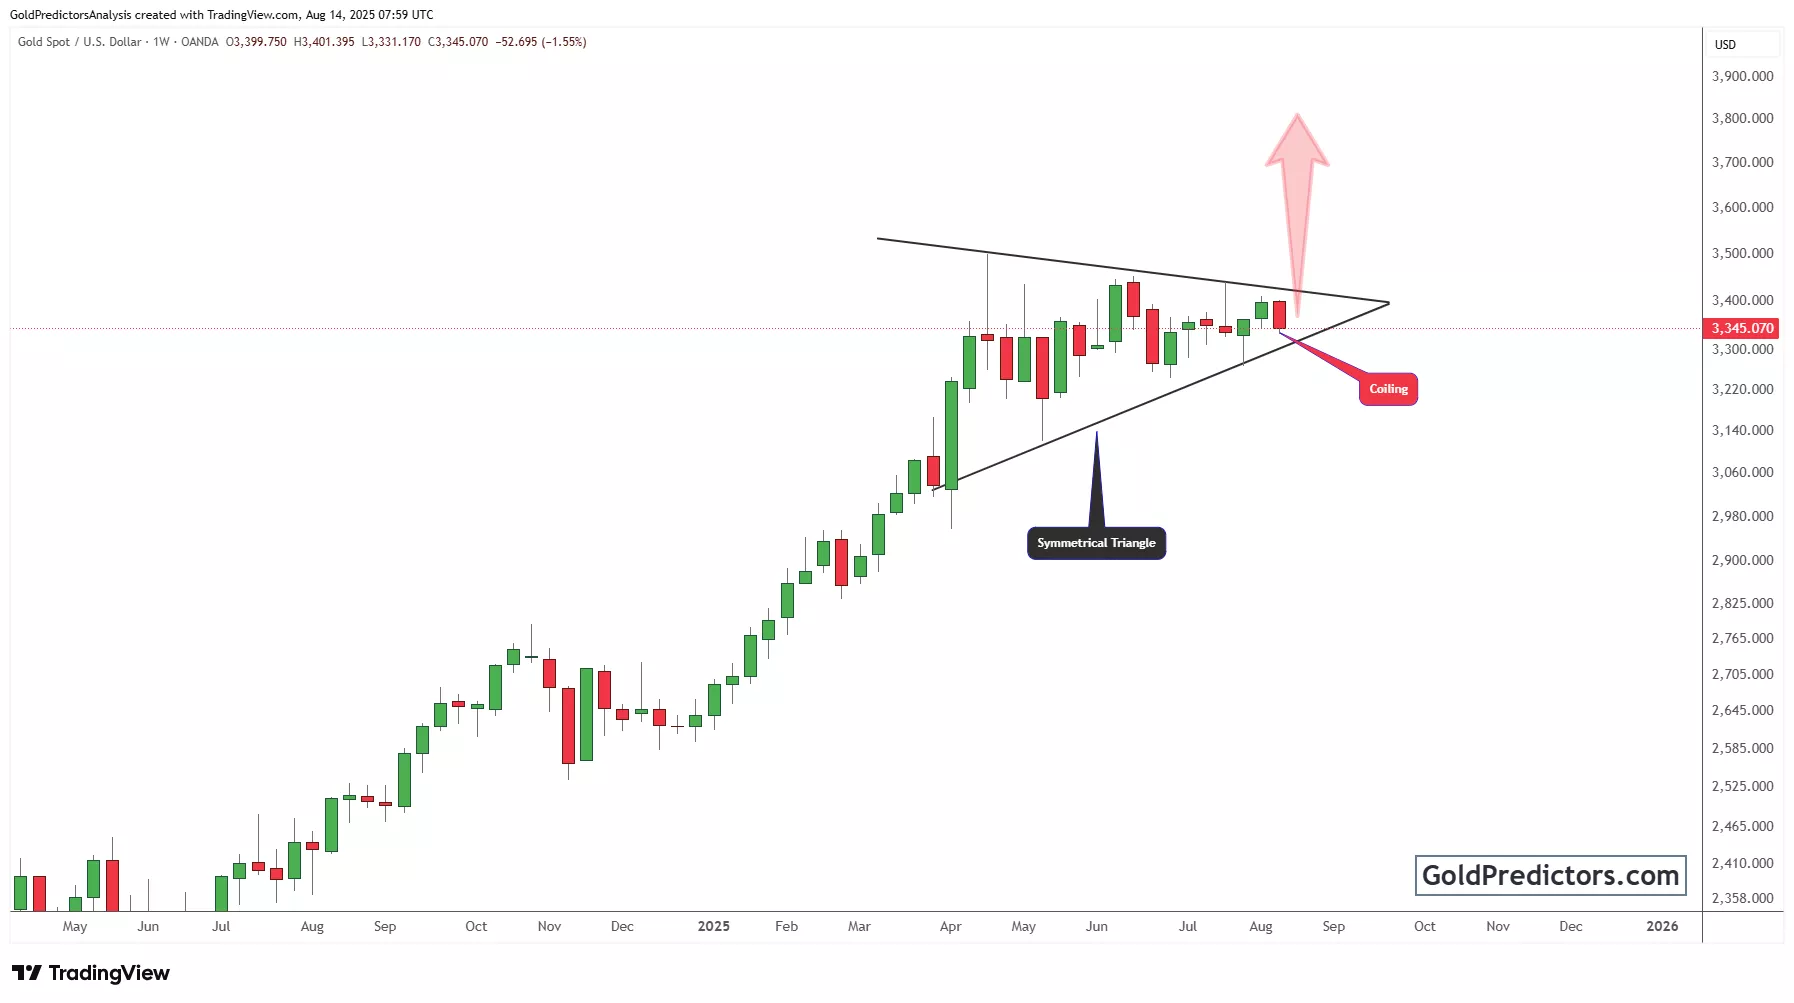
The recent candles show price rejection near the upper trendline. However, support at the lower trendline remains intact. The price is hovering around $3,345, showing signs of compression. A breakout above the triangle resistance could trigger a powerful rally. The arrow on the chart highlights the potential breakout path.
Volume remains moderate, suggesting the market is waiting for confirmation. A weekly close above the upper boundary could bring fresh buying interest. Such a move might target $3,600 or higher. On the downside, failure to hold support may invite short-term weakness. Still, the overall structure favors a bullish continuation once a breakout occurs.
Conclusion
Gold is trading within a narrow range, maintaining a favorable technical structure. It gains support from a weaker US Dollar, easing inflation, and improving global sentiment. Broader market optimism may limit safe-haven flows in the short term. However, the symmetrical triangle pattern signals a possible breakout. Upcoming Fed commentary and economic data will likely shape gold’s next major move. Until then, the market is watching closely for a strong breakout signal.
More By This Author:
Gold Maintains Uptrend As CPI Report And Tariff Truce Boost Sentiment
Gold Faces Brief Pullback As Investors Weigh Tariffs And Fed Rate Outlook
Gold Eyes Breakout As Trade Tensions And Fed Rate Cut Bets Intensify


Comments
Log in or sign up to join the conversation.