
Gold Eyes Breakout As Trade Tensions And Fed Rate Cut Bets Intensify

Image Source: Pixabay
Gold (XAUUSD) strengthens as investors seek safety amid tariffs and economic concerns. New U.S. trade measures on India and Japan increase global uncertainty and revive fears of a trade war. At the same time, soft economic indicators raise expectations for Fed rate cuts, which weaken the dollar and support gold prices. Despite improved stock market sentiment, demand for gold as a safe haven remains strong. Technical chart also displays bullish signals, with repeated resistance tests indicating a potential breakout.
Gold Strengthens on Global Uncertainty and Dovish Fed Signals
Rising trade tensions spark a flight to safety, sending gold prices upward. The latest tariffs announced by former President Trump, including a 25% hike on Indian imports and a possible 15% duty on Japanese goods, have increased global uncertainty. These moves raise concerns about a potential resurgence of the trade war. As a result, investors are shifting their focus toward gold.
At the same time, expectations for U.S. rate cuts continue to rise. Weak economic data, including the Nonfarm Payrolls and ISM Services PMI, have strengthened the case for policy easing. Traders now expect at least two Fed rate cuts by year-end, with the first likely in September. This outlook puts pressure on the U.S. dollar, supporting the price of gold.
Meanwhile, the dollar struggles to recover from recent lows. A declining dollar usually supports gold demand. Gold’s upward bias persists, even with improved sentiment in the stock market. This suggests that safe-haven demand remains strong, and gold may continue to rise if the Fed becomes more dovish.
Technical Analysis: Gold Eyes Breakout after Multiple Resistance Tests
The gold chart below shows a bullish technical formation. The price has tested the same resistance level four times without a breakout. Each push toward $3,480 met with resistance and failed to break through. This repeated failure highlights a key supply area where sellers continue to push the price down.
(Click on image to enlarge)
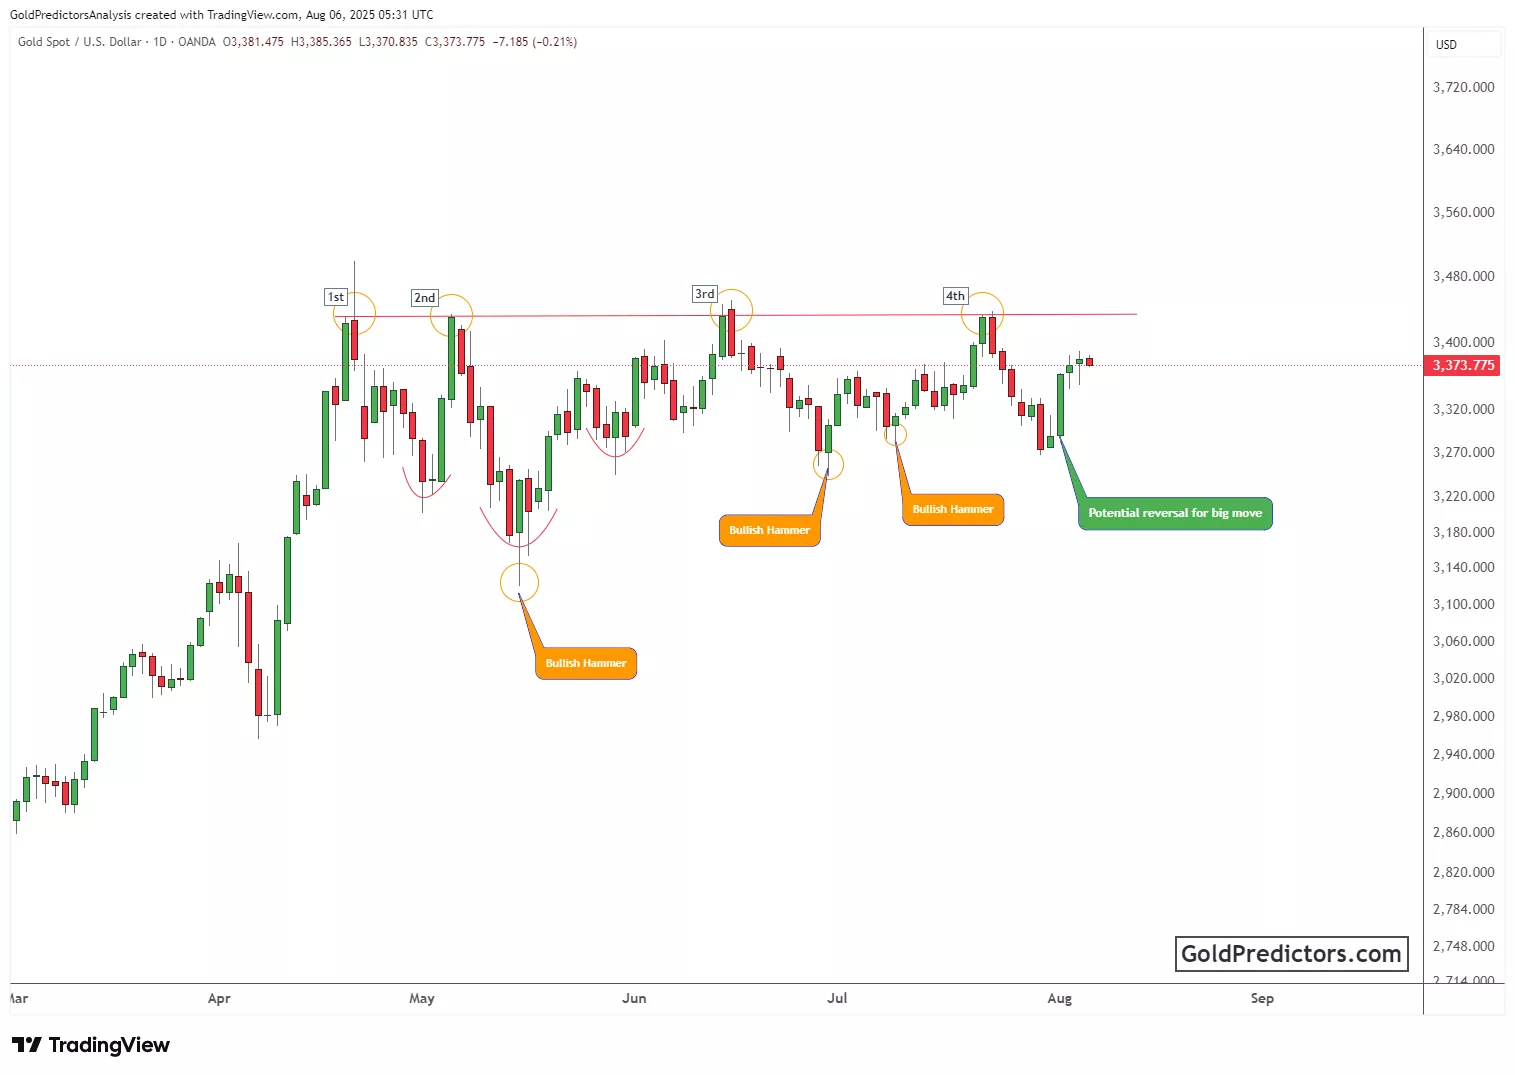
Each pullback has been followed by clear bullish signals. The chart consistently features bullish hammer candles as a key signal. These candles usually form after a decline and often indicate a reversal. Their frequent appearance suggests that buyers are stepping in strongly each time the price dips.
The chart also shows multiple rounded bottom patterns, which signal buyer control after each drop. The latest section displays another bullish hammer, followed by a sharp upward move. A green label marks this as a “Potential reversal for big move,” indicating possible upside momentum. If gold breaks above $3,480, it could trigger a strong rally. For now, the price sits just below resistance, though the market structure hints at a potential breakout.
Conclusion
Gold demonstrates resilience, supported by both market data and chart patterns. Trade tensions and dovish Fed expectations support safe-haven demand. The dollar remains weak, further boosting gold's appeal. Technical strength continues to build, indicating that a breakout led by buyers may be imminent. If gold clears the $3,480 resistance, a strong rally could follow. Until then, the overall bias remains firmly to the upside.
More By This Author:
Gold Prices Stabilize Despite Strong Dollar, Trump Comments, And Sticky Inflation
U.S. Growth And Cooling Inflation Push Gold Prices Lower
Gold Price Holds Ground Ahead Of Fed Policy Decision And GDP Release
To receive gold and silver trading signals and premium updates, please subscribe here.
Disclosure: Materials distributed by ...
more

